Estimated Value: $236,178 - $253,000
3
Beds
2
Baths
1,336
Sq Ft
$184/Sq Ft
Est. Value
About This Home
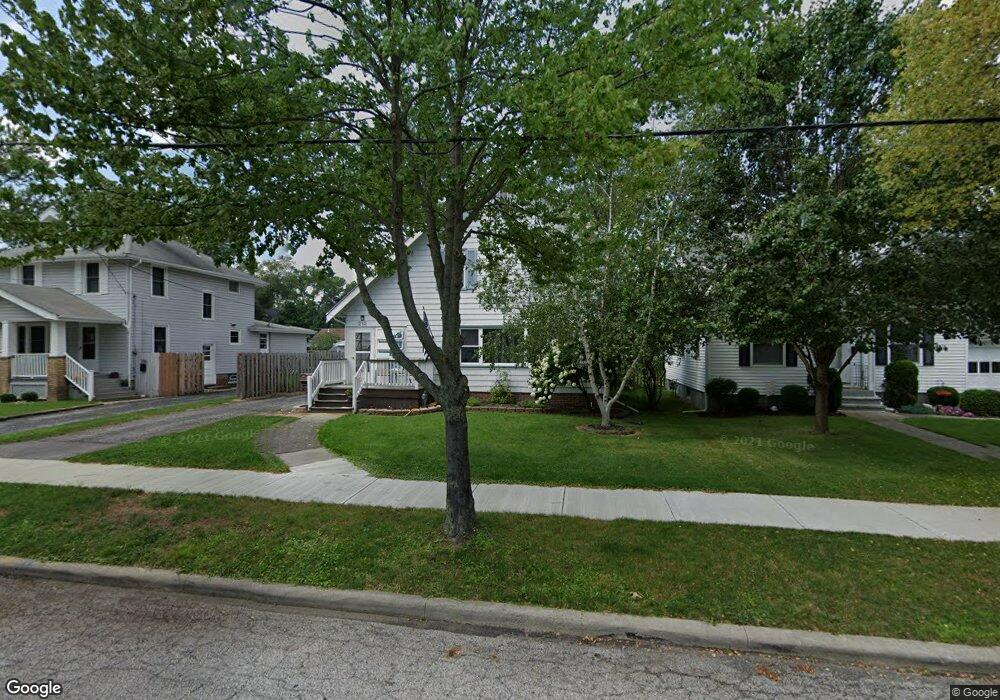
This home is located at 212 Gibson St, Berea, OH 44017 and is currently estimated at $246,295, approximately $184 per square foot. 212 Gibson St is a home located in Cuyahoga County with nearby schools including Grindstone Elementary School, Berea-Midpark Middle School, and Berea-Midpark High School.
Ownership History
Date
Name
Owned For
Owner Type
Purchase Details
Closed on
Dec 16, 2003
Sold by
Lingle Joseph Burton and Lingle Michelle K
Bought by
Rhoden Timothy W and Rhoden Jyl K
Current Estimated Value
Home Financials for this Owner
Home Financials are based on the most recent Mortgage that was taken out on this home.
Original Mortgage
$141,775
Outstanding Balance
$66,383
Interest Rate
6.03%
Mortgage Type
FHA
Estimated Equity
$179,912
Purchase Details
Closed on
Jul 10, 1990
Sold by
Lingle Joseph Burton
Bought by
Lingle Joseph Burton
Purchase Details
Closed on
Feb 27, 1980
Sold by
Waggoner Bruce and Waggoner Bernadine
Bought by
Lingle Joseph Burton
Purchase Details
Closed on
Jan 1, 1975
Bought by
Waggoner Bruce and Waggoner Bernadine
Create a Home Valuation Report for This Property
The Home Valuation Report is an in-depth analysis detailing your home's value as well as a comparison with similar homes in the area
Home Values in the Area
Average Home Value in this Area
Purchase History
| Date | Buyer | Sale Price | Title Company |
|---|---|---|---|
| Rhoden Timothy W | $144,000 | -- | |
| Lingle Joseph Burton | -- | -- | |
| Lingle Joseph Burton | $62,900 | -- | |
| Waggoner Bruce | -- | -- |
Source: Public Records
Mortgage History
| Date | Status | Borrower | Loan Amount |
|---|---|---|---|
| Open | Rhoden Timothy W | $141,775 |
Source: Public Records
Tax History Compared to Growth
Tax History
| Year | Tax Paid | Tax Assessment Tax Assessment Total Assessment is a certain percentage of the fair market value that is determined by local assessors to be the total taxable value of land and additions on the property. | Land | Improvement |
|---|---|---|---|---|
| 2024 | $4,251 | $73,535 | $11,585 | $61,950 |
| 2023 | $3,684 | $53,340 | $9,240 | $44,100 |
| 2022 | $4,732 | $53,340 | $9,240 | $44,100 |
| 2021 | $5,231 | $53,340 | $9,240 | $44,100 |
| 2020 | $3,468 | $45,220 | $7,840 | $37,380 |
| 2019 | $3,376 | $129,200 | $22,400 | $106,800 |
| 2018 | $3,363 | $45,220 | $7,840 | $37,380 |
| 2017 | $3,677 | $45,960 | $7,460 | $38,500 |
| 2016 | $3,649 | $45,090 | $7,460 | $37,630 |
| 2015 | $3,384 | $45,090 | $7,460 | $37,630 |
| 2014 | $3,384 | $45,090 | $7,460 | $37,630 |
Source: Public Records
Map
Nearby Homes