212 Granada Rd Carpentersville, IL 60110
Estimated Value: $256,998 - $287,000
3
Beds
--
Bath
1,456
Sq Ft
$189/Sq Ft
Est. Value
About This Home
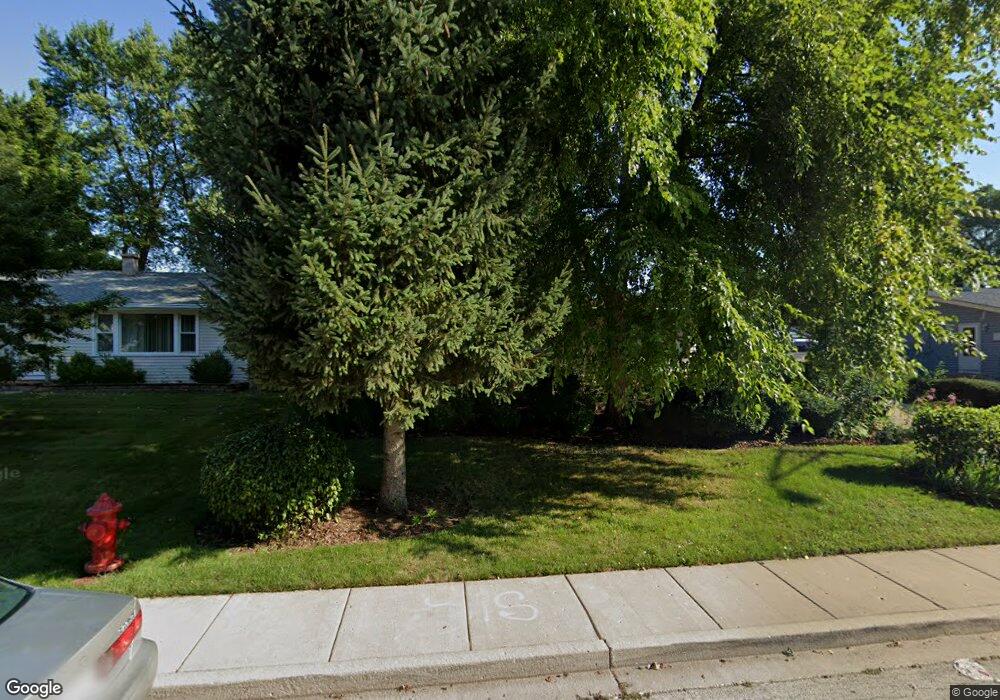
This home is located at 212 Granada Rd, Carpentersville, IL 60110 and is currently estimated at $275,750, approximately $189 per square foot. 212 Granada Rd is a home located in Kane County with nearby schools including Perry Elementary School, Crescent City Grade School, and Carpentersville Middle School.
Ownership History
Date
Name
Owned For
Owner Type
Purchase Details
Closed on
Oct 9, 2008
Sold by
Eugenio Roberto and Eugenio Gloria
Bought by
Otto Engineering Inc
Current Estimated Value
Purchase Details
Closed on
Apr 10, 2003
Sold by
Eugenio Roberto and Eugenio Gloria
Bought by
Eugenio Roberto and Eugenio Gloria
Home Financials for this Owner
Home Financials are based on the most recent Mortgage that was taken out on this home.
Original Mortgage
$127,500
Interest Rate
8.85%
Mortgage Type
Purchase Money Mortgage
Purchase Details
Closed on
Apr 30, 1998
Sold by
Siebold Renee R
Bought by
Eugenio Roberto and Eugenio Gloria
Home Financials for this Owner
Home Financials are based on the most recent Mortgage that was taken out on this home.
Original Mortgage
$104,650
Interest Rate
7.27%
Mortgage Type
FHA
Create a Home Valuation Report for This Property
The Home Valuation Report is an in-depth analysis detailing your home's value as well as a comparison with similar homes in the area
Home Values in the Area
Average Home Value in this Area
Purchase History
| Date | Buyer | Sale Price | Title Company |
|---|---|---|---|
| Otto Engineering Inc | $145,000 | Chicago Title Insurance Co | |
| Eugenio Roberto | -- | Law Title Ins Co | |
| Eugenio Roberto | $105,000 | -- |
Source: Public Records
Mortgage History
| Date | Status | Borrower | Loan Amount |
|---|---|---|---|
| Previous Owner | Eugenio Roberto | $127,500 | |
| Previous Owner | Eugenio Roberto | $104,650 |
Source: Public Records
Tax History Compared to Growth
Tax History
| Year | Tax Paid | Tax Assessment Tax Assessment Total Assessment is a certain percentage of the fair market value that is determined by local assessors to be the total taxable value of land and additions on the property. | Land | Improvement |
|---|---|---|---|---|
| 2024 | $5,925 | $78,236 | $12,553 | $65,683 |
| 2023 | $5,915 | $70,394 | $11,295 | $59,099 |
| 2022 | $5,526 | $63,459 | $11,295 | $52,164 |
| 2021 | $5,428 | $59,918 | $10,665 | $49,253 |
| 2020 | $5,351 | $58,571 | $10,425 | $48,146 |
| 2019 | $5,261 | $55,602 | $9,897 | $45,705 |
| 2018 | $5,064 | $51,024 | $9,701 | $41,323 |
| 2017 | $4,896 | $47,731 | $9,075 | $38,656 |
| 2016 | $4,586 | $41,688 | $8,787 | $32,901 |
| 2015 | -- | $34,571 | $8,234 | $26,337 |
| 2014 | -- | $30,873 | $8,007 | $22,866 |
| 2013 | -- | $31,818 | $8,252 | $23,566 |
Source: Public Records
Map
Nearby Homes
- 105 Siesta Rd
- 1426 Kings Rd
- 200 Amarillo Dr
- 308 Amarillo Ct
- 140 Hickory Dr
- 171 Lake Shore Dr
- 103 Hickory Dr
- 149 Austin Ave
- 2013 Silverstone Dr Unit 2013
- 1431 Silverstone Dr Unit 1416
- 181 Skyline Dr
- 7 Austin Ave
- 327 Tulsa Ave
- 4 Austin Ave
- 1309 Silverstone Dr Unit 1305
- 1303 Silverstone Dr Unit 1302
- 713 Silverstone Dr Unit 77
- 1811 IL Rte 25 (Elgin) Rd
- 57 Robin Rd
- 135 Indian Ln