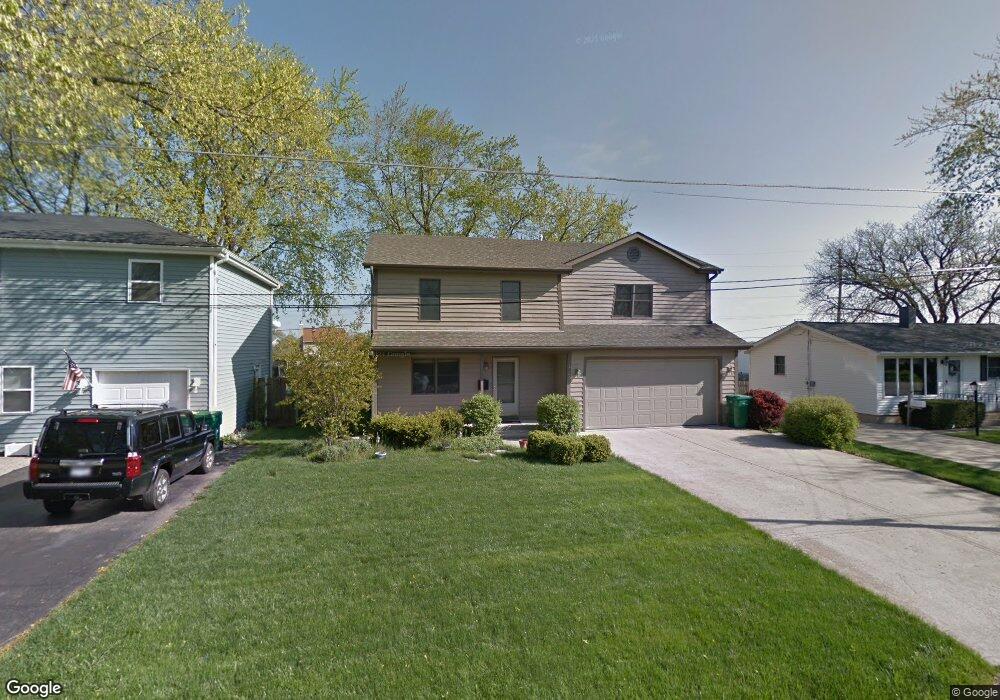
212 Heather Ave Grayslake, IL 60030
Estimated Value: $414,000 - $463,000
4
Beds
3
Baths
2,178
Sq Ft
$199/Sq Ft
Est. Value
About This Home
This home is located at 212 Heather Ave, Grayslake, IL 60030 and is currently estimated at $433,944, approximately $199 per square foot. 212 Heather Ave is a home located in Lake County with nearby schools including Frederick School, Woodview School, and Grayslake Middle School.
Ownership History
Date
Name
Owned For
Owner Type
Purchase Details
Closed on
Jul 10, 2020
Sold by
Schwebel Paul and Schwebel Ammie
Bought by
Schwebel Paul and Schwebel Ammie
Current Estimated Value
Home Financials for this Owner
Home Financials are based on the most recent Mortgage that was taken out on this home.
Original Mortgage
$196,000
Outstanding Balance
$138,540
Interest Rate
3.12%
Mortgage Type
New Conventional
Estimated Equity
$295,404
Purchase Details
Closed on
Sep 25, 2009
Sold by
Farm Trenton N and Farm Michele M
Bought by
Schwebel Paul and Schwebel Keith Ammie
Home Financials for this Owner
Home Financials are based on the most recent Mortgage that was taken out on this home.
Original Mortgage
$220,725
Interest Rate
5.15%
Mortgage Type
New Conventional
Purchase Details
Closed on
Jan 31, 1994
Sold by
Mccullough James
Bought by
Farm Trenton N and Farm Michele M
Create a Home Valuation Report for This Property
The Home Valuation Report is an in-depth analysis detailing your home's value as well as a comparison with similar homes in the area
Home Values in the Area
Average Home Value in this Area
Purchase History
| Date | Buyer | Sale Price | Title Company |
|---|---|---|---|
| Schwebel Paul | -- | Solidifi | |
| Schwebel Paul | $245,500 | Fort Dearborn Land Title Llc | |
| Farm Trenton N | $25,000 | -- |
Source: Public Records
Mortgage History
| Date | Status | Borrower | Loan Amount |
|---|---|---|---|
| Open | Schwebel Paul | $196,000 | |
| Closed | Schwebel Paul | $220,725 |
Source: Public Records
Tax History
| Year | Tax Paid | Tax Assessment Tax Assessment Total Assessment is a certain percentage of the fair market value that is determined by local assessors to be the total taxable value of land and additions on the property. | Land | Improvement |
|---|---|---|---|---|
| 2024 | $11,880 | $118,786 | $32,291 | $86,495 |
| 2023 | $10,097 | $109,018 | $29,636 | $79,382 |
| 2022 | $10,097 | $90,197 | $10,850 | $79,347 |
| 2021 | $9,367 | $81,753 | $10,429 | $71,324 |
| 2020 | $11,080 | $90,968 | $9,923 | $81,045 |
| 2019 | $10,210 | $83,565 | $9,520 | $74,045 |
| 2018 | $9,870 | $81,519 | $16,516 | $65,003 |
| 2017 | $9,816 | $76,681 | $15,536 | $61,145 |
| 2016 | $9,416 | $70,784 | $14,341 | $56,443 |
| 2015 | $9,171 | $64,667 | $13,102 | $51,565 |
| 2014 | $5,224 | $39,151 | $11,186 | $27,965 |
| 2012 | $5,176 | $40,888 | $11,682 | $29,206 |
Source: Public Records
Map
Nearby Homes
- 75 Whispering Oaks Ln
- 21238 W Washington St
- 1074 Potomac Ct
- 417 Lawrence Ave
- 1121 Williamsburg Cir
- 20295 W Washington St
- 367 N Lake St
- 34625 N Il Route 83
- 83 Keeneland Ct
- 470 Ziegler Dr
- 21570 W Eldor Ave
- 545 Pheasant Ct
- 346 Mitchell Dr
- 673 Cardinal Ct
- 349 Woodland Dr Unit 6
- 1095 Ellsworth Dr
- 831 Amelia Ct
- 860 Amelia Ct
- 307 Fairfax Ln
- 301 Gatewood Ln
- 218 Heather Ave
- 206 Heather Ave
- 224 Heather Ave
- 204 Heather Ave
- 230 Heather Ave
- 211 Heather Ave
- 217 Heather Ave
- 725 Stuart St
- 223 Heather Ave
- 236 Heather Ave
- 229 Heather Ave
- 732 Stuart St
- 868 Tylerton Cir
- 878 Tylerton Cir
- 726 Stuart St
- 235 Heather Ave
- 864 Tylerton Cir
- 884 Tylerton Cir
- 720 Stuart St
- 860 Tylerton Cir
Your Personal Tour Guide
Ask me questions while you tour the home.