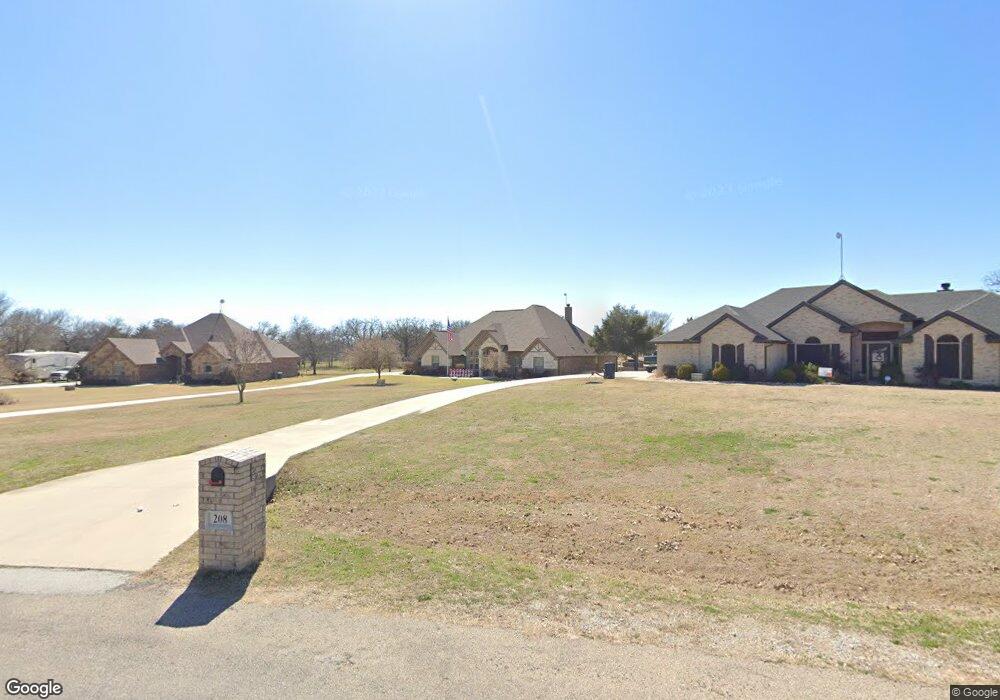
212 Hidden Creek Loop Weatherford, TX 76085
Estimated Value: $543,000 - $714,000
3
Beds
2
Baths
2,516
Sq Ft
$243/Sq Ft
Est. Value
About This Home
This home is located at 212 Hidden Creek Loop, Weatherford, TX 76085 and is currently estimated at $612,557, approximately $243 per square foot. 212 Hidden Creek Loop is a home located in Parker County with nearby schools including Crockett Elementary School, Tison Middle School, and Weatherford High School.
Ownership History
Date
Name
Owned For
Owner Type
Purchase Details
Closed on
Mar 14, 2014
Sold by
Ray French Land Company Ltd
Bought by
Fowler Brianna Kimble
Current Estimated Value
Home Financials for this Owner
Home Financials are based on the most recent Mortgage that was taken out on this home.
Original Mortgage
$215,039
Outstanding Balance
$163,116
Interest Rate
4.36%
Mortgage Type
New Conventional
Estimated Equity
$449,441
Purchase Details
Closed on
Jan 24, 2013
Sold by
W & L Jones Realty Holdings Lp
Bought by
Fowler Brianna Kimble
Purchase Details
Closed on
Jan 15, 2009
Sold by
Oak Leaf Homes Llc
Bought by
Fowler Brianna Kimble
Purchase Details
Closed on
Jul 13, 2005
Sold by
Western Group Llc
Bought by
Fowler Brianna Kimble
Create a Home Valuation Report for This Property
The Home Valuation Report is an in-depth analysis detailing your home's value as well as a comparison with similar homes in the area
Home Values in the Area
Average Home Value in this Area
Purchase History
| Date | Buyer | Sale Price | Title Company |
|---|---|---|---|
| Fowler Brianna Kimble | -- | Providence Title Company | |
| Fowler Brianna Kimble | -- | -- | |
| Fowler Brianna Kimble | -- | -- | |
| Fowler Brianna Kimble | -- | -- |
Source: Public Records
Mortgage History
| Date | Status | Borrower | Loan Amount |
|---|---|---|---|
| Open | Fowler Brianna Kimble | $215,039 |
Source: Public Records
Tax History Compared to Growth
Tax History
| Year | Tax Paid | Tax Assessment Tax Assessment Total Assessment is a certain percentage of the fair market value that is determined by local assessors to be the total taxable value of land and additions on the property. | Land | Improvement |
|---|---|---|---|---|
| 2025 | $7,881 | $606,684 | -- | -- |
| 2024 | $7,881 | $547,349 | -- | -- |
| 2023 | $7,881 | $497,590 | $0 | $0 |
| 2022 | $7,999 | $429,630 | $60,000 | $369,630 |
| 2021 | $8,364 | $429,630 | $60,000 | $369,630 |
| 2020 | $7,641 | $376,700 | $30,000 | $346,700 |
| 2019 | $8,151 | $376,700 | $30,000 | $346,700 |
| 2018 | $7,578 | $348,960 | $30,000 | $318,960 |
| 2017 | $7,030 | $348,960 | $30,000 | $318,960 |
| 2016 | $6,391 | $287,930 | $30,000 | $257,930 |
| 2015 | $5,936 | $287,930 | $30,000 | $257,930 |
| 2014 | $5,308 | $262,150 | $25,000 | $237,150 |
Source: Public Records
Map
Nearby Homes
- 1860 Trailwood Dr
- 161 Cochran Rd
- 150 Ellis Spring Dr
- 107 W Stagecoach Trail
- Lot 118 Stonebridge Dr
- Lot 117 Stonebridge Dr
- 104 W Stagecoach Trail
- 368 Green Branch Rd
- 737 Green Branch Rd
- Haven Plan at Wossum Ranch
- 1300 Green Ridge Rd
- Vista Plan at Wossum Ranch
- 209 Ellis Creek Dr
- 1305 Green Ridge Rd
- 600 Joyce St
- 1337 Eagle Dr
- 1301 Eagle Dr
- 901 Green Branch Rd
- 707 Wells Ln
- 707 Gail Dr
- 218 Hidden Creek Loop
- 208 Hidden Creek Loop
- 196 Hidden Creek Loop
- 224 Hidden Creek Loop
- 207 Hidden Creek Loop
- 190 Hidden Creek Loop
- 184 Hidden Creek Loop
- 230 Hidden Creek Loop
- 225 Hidden Creek Loop
- 177 Hidden Creek Loop
- 214 Hidden Creek Loop
- 178 Hidden Creek Loop
- 172 Hidden Creek Loop
- 235 Hidden Creek Loop
- 236 Hidden Creek Loop
- 163 Hidden Creek Loop
- 166 Hidden Creek Loop
- 153 Hidden Creek Loop
- 239 Hidden Creek Loop
- 160 Hidden Creek Loop