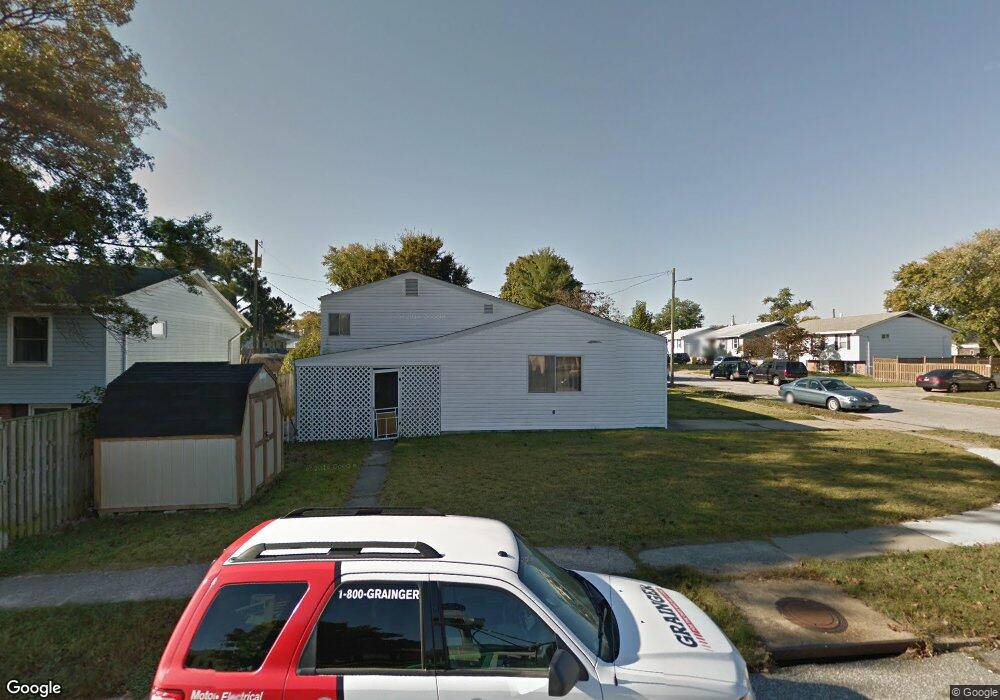
212 Juniper Dr Glen Burnie, MD 21060
Estimated Value: $378,411 - $419,000
--
Bed
2
Baths
1,985
Sq Ft
$204/Sq Ft
Est. Value
About This Home
This home is located at 212 Juniper Dr, Glen Burnie, MD 21060 and is currently estimated at $404,103, approximately $203 per square foot. 212 Juniper Dr is a home located in Anne Arundel County with nearby schools including Point Pleasant Elementary School, Marley Middle School, and Glen Burnie High School.
Ownership History
Date
Name
Owned For
Owner Type
Purchase Details
Closed on
May 16, 2016
Sold by
Polakoff Anthony
Bought by
Rusch Llc
Current Estimated Value
Purchase Details
Closed on
Mar 30, 2016
Sold by
King Steven
Bought by
Polakoff Anthony
Purchase Details
Closed on
May 30, 2001
Sold by
Ocwen Federal Bank
Bought by
Mullen Patrick and Mullen Regina
Purchase Details
Closed on
Jun 29, 1988
Sold by
Mack John
Bought by
Caltrider Robert S
Home Financials for this Owner
Home Financials are based on the most recent Mortgage that was taken out on this home.
Original Mortgage
$93,575
Interest Rate
10.4%
Create a Home Valuation Report for This Property
The Home Valuation Report is an in-depth analysis detailing your home's value as well as a comparison with similar homes in the area
Home Values in the Area
Average Home Value in this Area
Purchase History
| Date | Buyer | Sale Price | Title Company |
|---|---|---|---|
| Rusch Llc | -- | Attorney | |
| Polakoff Anthony | -- | Attorney | |
| King Steven | -- | Attorney | |
| Mullen Patrick | $134,900 | -- | |
| Ocwen Federal Bank | $75,000 | -- | |
| Caltrider Robert S | $91,000 | -- |
Source: Public Records
Mortgage History
| Date | Status | Borrower | Loan Amount |
|---|---|---|---|
| Previous Owner | Caltrider Robert S | $93,575 |
Source: Public Records
Tax History Compared to Growth
Tax History
| Year | Tax Paid | Tax Assessment Tax Assessment Total Assessment is a certain percentage of the fair market value that is determined by local assessors to be the total taxable value of land and additions on the property. | Land | Improvement |
|---|---|---|---|---|
| 2025 | $2,749 | $325,100 | $161,000 | $164,100 |
| 2024 | $2,749 | $301,667 | $0 | $0 |
| 2023 | $2,651 | $278,233 | $0 | $0 |
| 2022 | $2,457 | $254,800 | $124,600 | $130,200 |
| 2021 | $4,826 | $245,967 | $0 | $0 |
| 2020 | $2,328 | $237,133 | $0 | $0 |
| 2019 | $4,484 | $228,300 | $114,600 | $113,700 |
| 2018 | $2,271 | $224,000 | $0 | $0 |
| 2017 | $2,162 | $219,700 | $0 | $0 |
| 2016 | -- | $215,400 | $0 | $0 |
| 2015 | -- | $214,400 | $0 | $0 |
| 2014 | -- | $213,400 | $0 | $0 |
Source: Public Records
Map
Nearby Homes
- 116 Juniper Ct
- 906 Silver Maple Ct
- 216 Daffodil Rd
- 202 Hollywood Ct
- 103 Sunset Dr
- 907 Princeton Terrace
- 900 Princeton Terrace
- 400 Renfro Dr
- 454 Renfro Ct
- 1009 Langley Rd
- 7327 E Furnace Branch Rd
- 1319 Meadowvale Rd
- 1033 Genine Dr
- 1609 Annapolis Dr
- 933 Andrews Rd
- 111 N Bend Terrace
- 1035 6th St
- 281 Thompson Ave E
- 1531 Furnace Ave
- 18 Ivy Ln
- 214 Juniper Dr
- 125 Inglewood Dr
- 210 Juniper Dr
- 216 Juniper Dr
- 123 Inglewood Dr
- 128 Inglewood Dr
- 114 Juniper Ct
- 217 Juniper Dr
- 208 Juniper Dr
- 221 Juniper Dr
- 126 Inglewood Dr
- 215 Juniper Dr
- 112 Juniper Ct
- 223 Juniper Dr
- 213 Juniper Dr
- 124 Inglewood Dr
- 206 Juniper Dr
- 131 Hollywood Dr
- 119 Inglewood Dr
- 129 Hollywood Dr