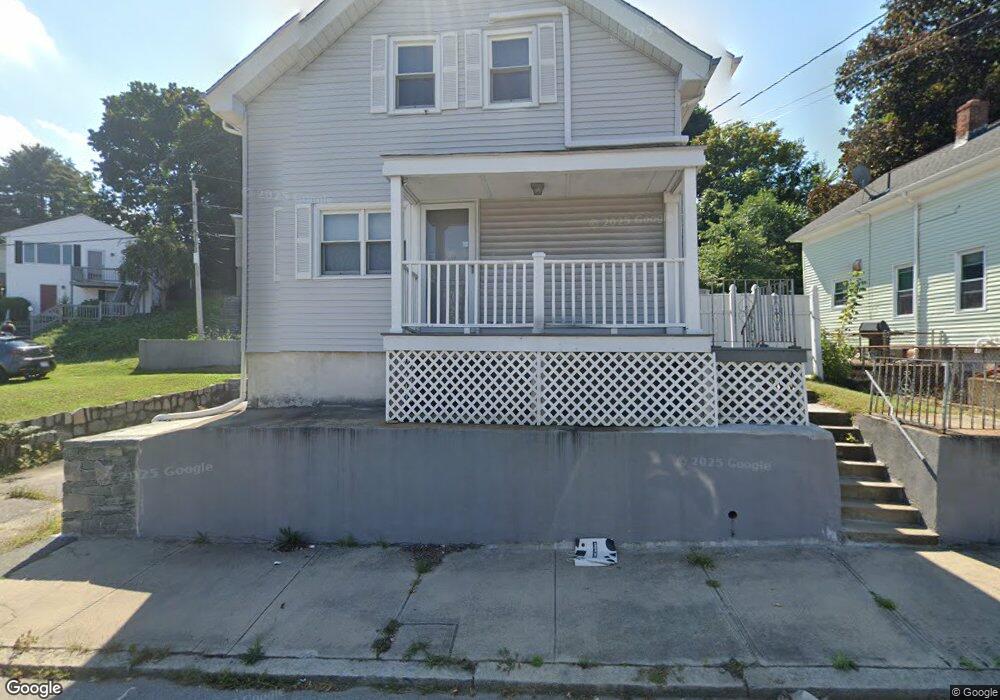
212 Killingly St Providence, RI 02909
Hartford NeighborhoodEstimated Value: $319,372 - $372,000
3
Beds
1
Bath
1,078
Sq Ft
$326/Sq Ft
Est. Value
About This Home
This home is located at 212 Killingly St, Providence, RI 02909 and is currently estimated at $351,343, approximately $325 per square foot. 212 Killingly St is a home located in Providence County with nearby schools including Achievement First Promesa and Achievement First Providence Mayoral Academy Elementary.
Ownership History
Date
Name
Owned For
Owner Type
Purchase Details
Closed on
Jun 9, 2016
Sold by
Hall Catherine D
Bought by
Hall Catherine D
Current Estimated Value
Purchase Details
Closed on
Apr 19, 1999
Sold by
Bruno Nicole
Bought by
Hall Catherine
Home Financials for this Owner
Home Financials are based on the most recent Mortgage that was taken out on this home.
Original Mortgage
$54,000
Interest Rate
7.04%
Purchase Details
Closed on
Oct 2, 1997
Sold by
Yuppa Thomas J and Yuppa Paula
Bought by
Bruno Nicole
Home Financials for this Owner
Home Financials are based on the most recent Mortgage that was taken out on this home.
Original Mortgage
$63,000
Interest Rate
7.41%
Purchase Details
Closed on
Oct 21, 1988
Sold by
Odonnell Kathleen
Bought by
Yuppa Thomas
Create a Home Valuation Report for This Property
The Home Valuation Report is an in-depth analysis detailing your home's value as well as a comparison with similar homes in the area
Home Values in the Area
Average Home Value in this Area
Purchase History
| Date | Buyer | Sale Price | Title Company |
|---|---|---|---|
| Hall Catherine D | -- | -- | |
| Hall Catherine | $72,000 | -- | |
| Bruno Nicole | $67,000 | -- | |
| Yuppa Thomas | $85,000 | -- |
Source: Public Records
Mortgage History
| Date | Status | Borrower | Loan Amount |
|---|---|---|---|
| Previous Owner | Yuppa Thomas | $86,300 | |
| Previous Owner | Yuppa Thomas | $15,000 | |
| Previous Owner | Yuppa Thomas | $54,000 | |
| Previous Owner | Yuppa Thomas | $63,000 |
Source: Public Records
Tax History
| Year | Tax Paid | Tax Assessment Tax Assessment Total Assessment is a certain percentage of the fair market value that is determined by local assessors to be the total taxable value of land and additions on the property. | Land | Improvement |
|---|---|---|---|---|
| 2025 | $2,444 | $291,000 | $134,100 | $156,900 |
| 2024 | $4,026 | $219,400 | $84,800 | $134,600 |
| 2023 | $4,026 | $219,400 | $84,800 | $134,600 |
| 2022 | $3,905 | $219,400 | $84,800 | $134,600 |
| 2021 | $3,539 | $144,100 | $48,000 | $96,100 |
| 2020 | $3,539 | $144,100 | $48,000 | $96,100 |
| 2019 | $3,539 | $144,100 | $48,000 | $96,100 |
| 2018 | $3,372 | $105,500 | $40,900 | $64,600 |
| 2017 | $3,372 | $105,500 | $40,900 | $64,600 |
| 2016 | $3,372 | $105,500 | $40,900 | $64,600 |
| 2015 | $3,178 | $96,000 | $40,900 | $55,100 |
| 2014 | $3,240 | $96,000 | $40,900 | $55,100 |
| 2013 | $3,240 | $96,000 | $40,900 | $55,100 |
Source: Public Records
Map
Nearby Homes
- 60 Ophelia St
- 10 Mott St
- 102 Ophelia St
- 0 Orchard St Unit 1396400
- 0 Orchard St Unit 1400488
- 231 Lowell Ave
- 15 Melissa St
- 162 Merino St
- 665 Plainfield St
- 33 Harding Ave
- 166 Lowell Ave
- 18 Crowninshield St
- 129 Glenbridge Ave
- 240 Eastwood Ave
- 29 Matson Ave Unit 35
- 19 S Long St
- 140 Cleveland St
- 173 Whittier Ave
- 68 Murray St
- 33 Prudence Ave
Your Personal Tour Guide
Ask me questions while you tour the home.