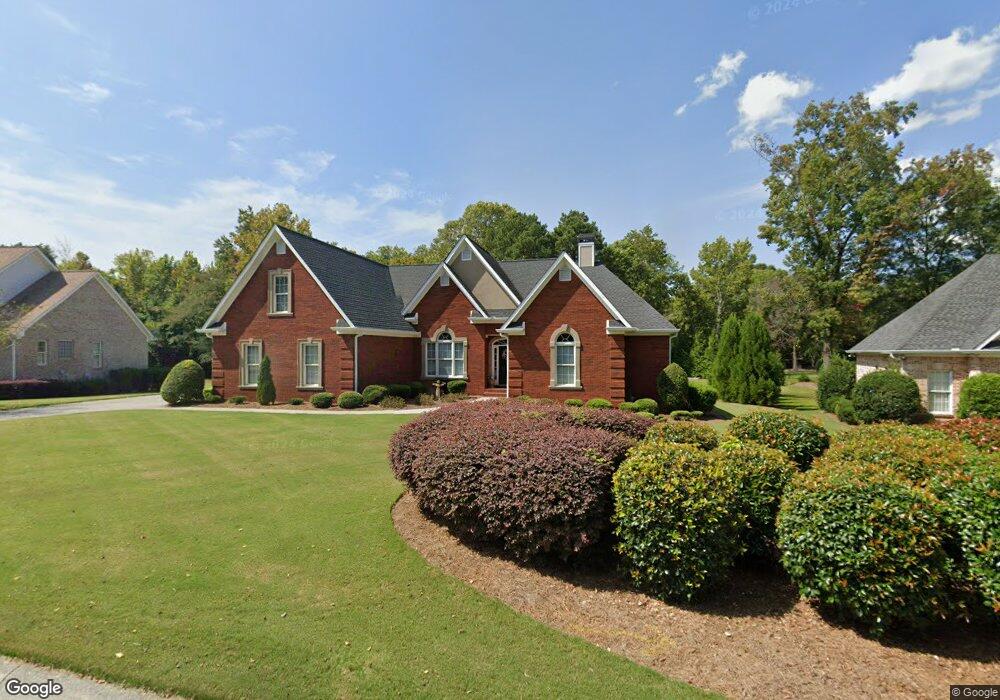
212 Laurel Creek Rd SE Calhoun, GA 30701
Estimated Value: $437,000 - $888,000
4
Beds
4
Baths
3,793
Sq Ft
$161/Sq Ft
Est. Value
About This Home
This home is located at 212 Laurel Creek Rd SE, Calhoun, GA 30701 and is currently estimated at $609,601, approximately $160 per square foot. 212 Laurel Creek Rd SE is a home located in Gordon County with nearby schools including Calhoun Primary School, Calhoun Elementary School, and Calhoun Middle School.
Ownership History
Date
Name
Owned For
Owner Type
Purchase Details
Closed on
Mar 25, 2016
Sold by
Adcock Gary S
Bought by
Brown Wesley S and Brown Kimberly L
Current Estimated Value
Home Financials for this Owner
Home Financials are based on the most recent Mortgage that was taken out on this home.
Original Mortgage
$308,000
Outstanding Balance
$244,204
Interest Rate
3.62%
Mortgage Type
New Conventional
Estimated Equity
$365,397
Purchase Details
Closed on
Mar 3, 2009
Sold by
Hall Tony K
Bought by
Adcock Gary S
Home Financials for this Owner
Home Financials are based on the most recent Mortgage that was taken out on this home.
Original Mortgage
$366,410
Interest Rate
5.29%
Mortgage Type
New Conventional
Purchase Details
Closed on
Jan 4, 2005
Sold by
Brent Stepp Construction I
Bought by
Hall Antnohy K and Hall Laura A
Purchase Details
Closed on
Dec 17, 2004
Sold by
Brent Stepp Construction Co Inc
Bought by
Hall Tony K and Hall Laura A
Create a Home Valuation Report for This Property
The Home Valuation Report is an in-depth analysis detailing your home's value as well as a comparison with similar homes in the area
Home Values in the Area
Average Home Value in this Area
Purchase History
| Date | Buyer | Sale Price | Title Company |
|---|---|---|---|
| Brown Wesley S | $385,000 | -- | |
| Adcock Gary S | $385,695 | -- | |
| Hall Antnohy K | $325,000 | -- | |
| Hall Tony K | $325,000 | -- |
Source: Public Records
Mortgage History
| Date | Status | Borrower | Loan Amount |
|---|---|---|---|
| Open | Brown Wesley S | $308,000 | |
| Previous Owner | Adcock Gary S | $366,410 |
Source: Public Records
Tax History Compared to Growth
Tax History
| Year | Tax Paid | Tax Assessment Tax Assessment Total Assessment is a certain percentage of the fair market value that is determined by local assessors to be the total taxable value of land and additions on the property. | Land | Improvement |
|---|---|---|---|---|
| 2024 | $5,390 | $192,360 | $11,200 | $181,160 |
| 2023 | $5,045 | $180,080 | $11,200 | $168,880 |
| 2022 | $1,584 | $168,520 | $11,200 | $157,320 |
| 2021 | $4,201 | $141,760 | $11,200 | $130,560 |
| 2020 | $4,286 | $143,480 | $11,200 | $132,280 |
| 2019 | $4,280 | $143,480 | $11,200 | $132,280 |
| 2018 | $1,353 | $140,480 | $11,200 | $129,280 |
| 2017 | $1,312 | $133,520 | $11,200 | $122,320 |
| 2016 | $1,316 | $133,520 | $11,200 | $122,320 |
| 2015 | $1,309 | $131,200 | $11,200 | $120,000 |
| 2014 | $1,253 | $127,268 | $11,200 | $116,068 |
Source: Public Records
Map
Nearby Homes
- 114 Vinings Way SE
- 107 Savoy Place SE
- 220 Lenox Rd SE
- 104 Bobwhite Dr
- 107 Bobwhite Dr
- 105 Bobwhite Dr
- 209 Willowbrook Dr SE
- 200 Wildwood Cir SE
- 112 Willowbrook Dr SE
- 62 Professional Place Unit 30
- 212 Sherwood Dr
- The Pearson Plan at Creekview
- The Coleman Plan at Creekview
- The Benson II Plan at Creekview
- The Piedmont Plan at Creekview
- The Harrington Plan at Creekview
- The McGinnis Plan at Creekview
- The Caldwell Plan at Creekview
- 202 Montclair Dr
- 402 Linda Ln
- 214 Laurel Creek Rd SE
- 208 Laurel Creek Rd SE
- 216 Laurel Creek Rd SE
- 211 Laurel Creek Rd SE
- 103 Covington Ln SE
- 209 Laurel Creek Rd SE
- 213 Laurel Creek Rd SE
- 207 Laurel Creek Rd SE
- 102 Covington Ln SE
- 119 Vinings Way SE
- 126 Vinings Way SE
- 109 Covington Ln SE
- 104 Covington Ln SE
- 117 Vinings Way SE
- 203 Laurel Creek Rd SE
- 101 Bristol Place SE
- 106 Covington Ln SE
- 115 Vinings Way SE
- 103 Bristol Place SE
- 113 Vinings Way SE