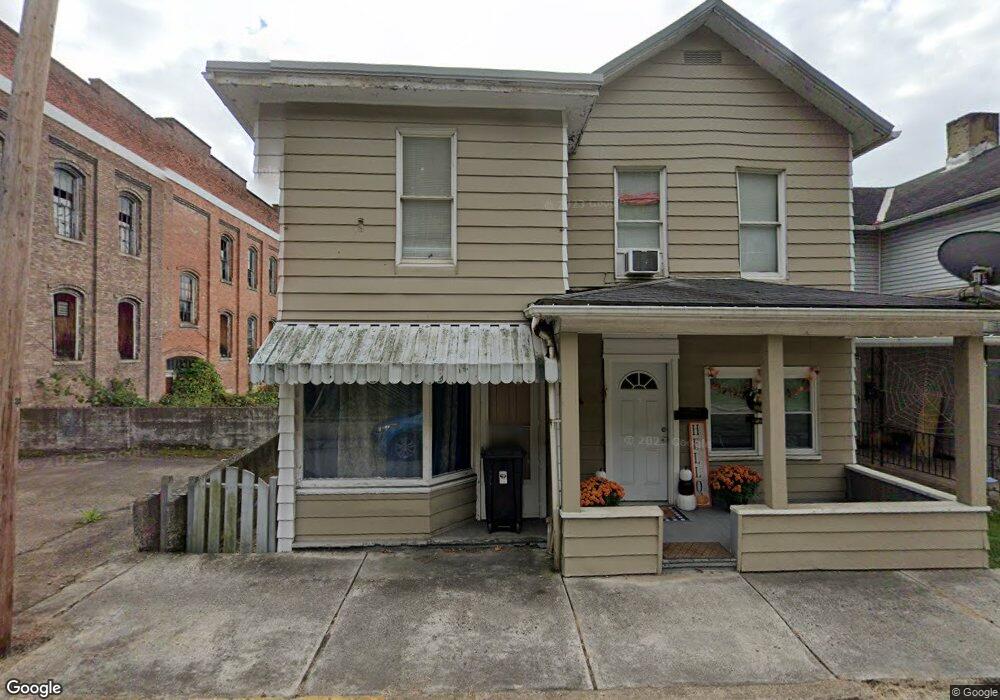
212 Main St Brownsville, PA 15417
Estimated Value: $51,000 - $100,025
3
Beds
1
Bath
1,641
Sq Ft
$49/Sq Ft
Est. Value
About This Home
This home is located at 212 Main St, Brownsville, PA 15417 and is currently estimated at $79,756, approximately $48 per square foot. 212 Main St is a home located in Washington County with nearby schools including Brownsville Area Elementary School, Brownsville Area Middle School, and Brownsville Area High School.
Ownership History
Date
Name
Owned For
Owner Type
Purchase Details
Closed on
Nov 24, 2023
Sold by
Klaus James W
Bought by
Beck Edward J and Beck Catherine E
Current Estimated Value
Purchase Details
Closed on
Jul 6, 2018
Sold by
Everett Holly
Bought by
Klaus James W
Purchase Details
Closed on
Jul 5, 2018
Sold by
Orellana Carol Miquel
Bought by
Everett Holly
Purchase Details
Closed on
Oct 1, 2013
Sold by
Kudyba Bernard C
Bought by
Everett Holly
Create a Home Valuation Report for This Property
The Home Valuation Report is an in-depth analysis detailing your home's value as well as a comparison with similar homes in the area
Home Values in the Area
Average Home Value in this Area
Purchase History
| Date | Buyer | Sale Price | Title Company |
|---|---|---|---|
| Beck Edward J | $28,540 | None Listed On Document | |
| Klaus James W | $5,000 | None Available | |
| Everett Holly | -- | None Available | |
| Everett Holly | $5,000 | -- |
Source: Public Records
Tax History Compared to Growth
Tax History
| Year | Tax Paid | Tax Assessment Tax Assessment Total Assessment is a certain percentage of the fair market value that is determined by local assessors to be the total taxable value of land and additions on the property. | Land | Improvement |
|---|---|---|---|---|
| 2025 | $1,107 | $52,000 | $12,600 | $39,400 |
| 2024 | $956 | $52,000 | $12,600 | $39,400 |
| 2023 | $956 | $52,000 | $12,600 | $39,400 |
| 2022 | $967 | $52,000 | $12,600 | $39,400 |
| 2021 | $955 | $52,000 | $12,600 | $39,400 |
| 2020 | $913 | $52,000 | $12,600 | $39,400 |
| 2019 | $888 | $52,000 | $12,600 | $39,400 |
| 2018 | $840 | $52,000 | $12,600 | $39,400 |
| 2017 | $128 | $52,000 | $12,600 | $39,400 |
| 2016 | $128 | $5,152 | $925 | $4,227 |
| 2015 | -- | $5,152 | $925 | $4,227 |
| 2014 | $128 | $5,152 | $925 | $4,227 |
| 2013 | $128 | $5,152 | $925 | $4,227 |
Source: Public Records
Map
Nearby Homes