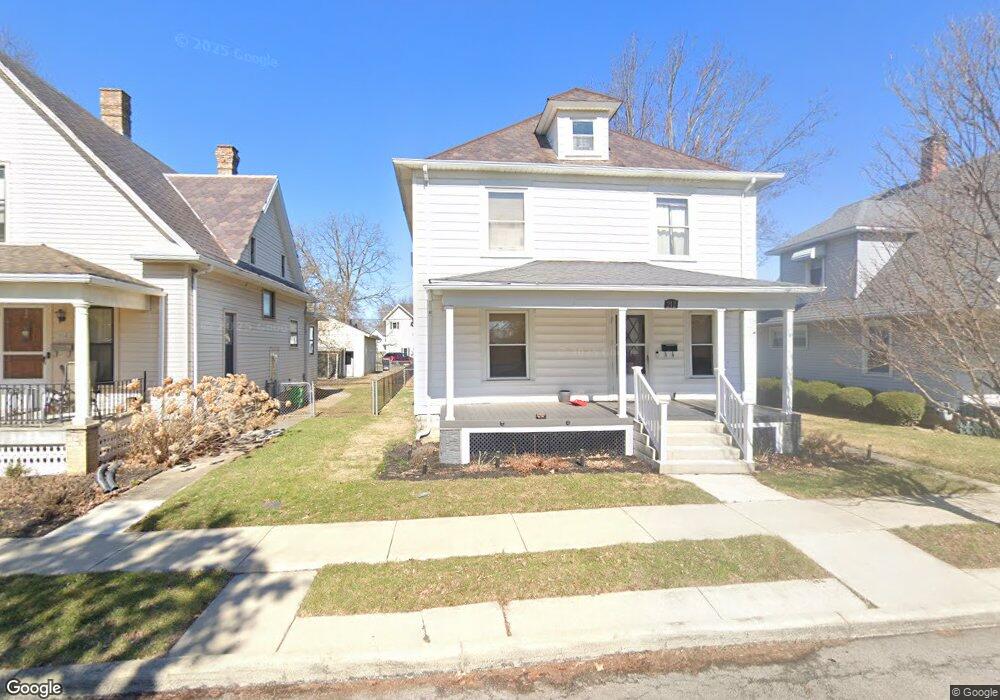
212 Mound St Findlay, OH 45840
Estimated Value: $226,153 - $237,000
4
Beds
2
Baths
1,971
Sq Ft
$117/Sq Ft
Est. Value
About This Home
This home is located at 212 Mound St, Findlay, OH 45840 and is currently estimated at $231,538, approximately $117 per square foot. 212 Mound St is a home located in Hancock County with nearby schools including Lincoln Elementary School, Donnell Middle School, and Findlay High School.
Ownership History
Date
Name
Owned For
Owner Type
Purchase Details
Closed on
Sep 1, 2005
Sold by
Aller Jerry L
Bought by
Gibson Ernie L and Gibson Charissa R
Current Estimated Value
Home Financials for this Owner
Home Financials are based on the most recent Mortgage that was taken out on this home.
Original Mortgage
$141,550
Outstanding Balance
$89,066
Interest Rate
8.8%
Mortgage Type
Purchase Money Mortgage
Estimated Equity
$142,472
Purchase Details
Closed on
Nov 28, 2001
Sold by
Exc Larry L Aller
Bought by
Aller Jerry L
Home Financials for this Owner
Home Financials are based on the most recent Mortgage that was taken out on this home.
Original Mortgage
$85,600
Interest Rate
4.87%
Mortgage Type
New Conventional
Purchase Details
Closed on
Jul 6, 1988
Bought by
Aller Harold D and Aller Pauline
Create a Home Valuation Report for This Property
The Home Valuation Report is an in-depth analysis detailing your home's value as well as a comparison with similar homes in the area
Home Values in the Area
Average Home Value in this Area
Purchase History
| Date | Buyer | Sale Price | Title Company |
|---|---|---|---|
| Gibson Ernie L | $125,000 | -- | |
| Aller Jerry L | $107,000 | -- | |
| Aller Harold D | -- | -- |
Source: Public Records
Mortgage History
| Date | Status | Borrower | Loan Amount |
|---|---|---|---|
| Open | Gibson Ernie L | $141,550 | |
| Previous Owner | Aller Jerry L | $85,600 |
Source: Public Records
Tax History
| Year | Tax Paid | Tax Assessment Tax Assessment Total Assessment is a certain percentage of the fair market value that is determined by local assessors to be the total taxable value of land and additions on the property. | Land | Improvement |
|---|---|---|---|---|
| 2024 | $2,125 | $59,830 | $5,310 | $54,520 |
| 2023 | $2,129 | $59,830 | $5,310 | $54,520 |
| 2022 | $2,121 | $59,830 | $5,310 | $54,520 |
| 2021 | $1,817 | $44,640 | $5,450 | $39,190 |
| 2020 | $1,817 | $44,640 | $5,450 | $39,190 |
| 2019 | $1,780 | $44,640 | $5,450 | $39,190 |
| 2018 | $1,675 | $38,550 | $3,840 | $34,710 |
| 2017 | $1,676 | $38,550 | $3,840 | $34,710 |
| 2016 | $1,657 | $38,550 | $3,840 | $34,710 |
| 2015 | $1,312 | $30,000 | $3,840 | $26,160 |
| 2014 | $1,312 | $30,000 | $3,840 | $26,160 |
| 2012 | $1,322 | $30,000 | $3,840 | $26,160 |
Source: Public Records
Map
Nearby Homes
- 815 Liberty St
- 865 S Main St
- 412 Lima Ave
- 845 Hurd Ave
- 423 Elm St
- 860 Hurd Ave
- 1120 S West St
- 216 1st St
- 1113 Hurd Ave
- 829 Maple Ave
- 514 Liberty St
- 313 2nd St
- 123 Glendale Ave
- 527 W Sandusky St
- 324 W Mcpherson Ave
- 206 Greenlawn Ave
- 407 Washington St
- 608 W Front St
- 807 W Main Cross St
- 623 E Sandusky St
Your Personal Tour Guide
Ask me questions while you tour the home.