Estimated Value: $150,000 - $170,000
2
Beds
2
Baths
1,120
Sq Ft
$140/Sq Ft
Est. Value
About This Home
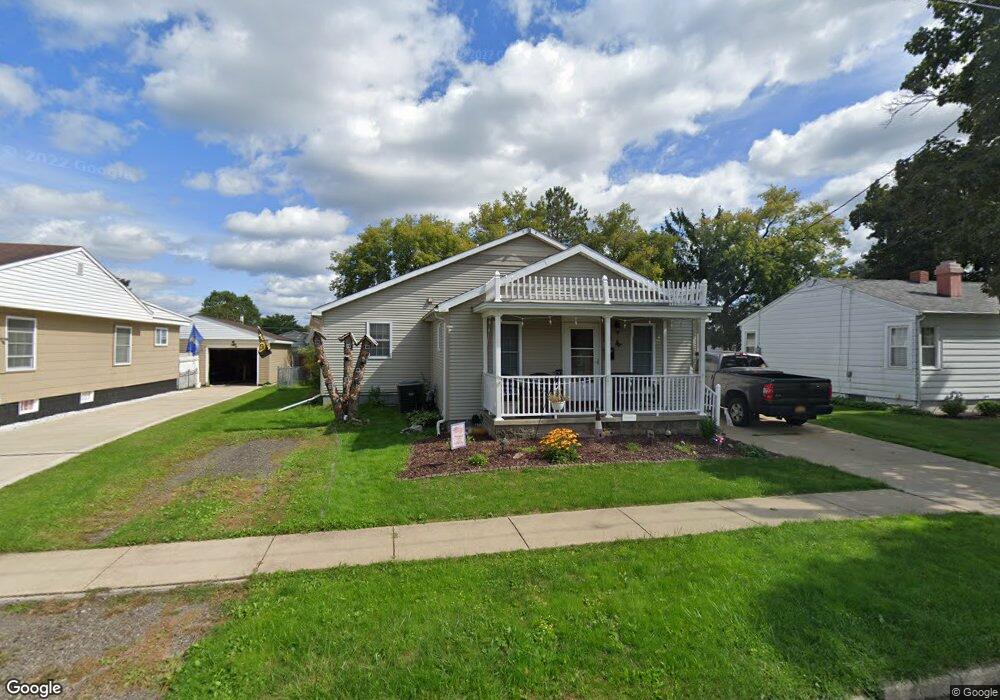
This home is located at 212 N 19th St, Olean, NY 14760 and is currently estimated at $156,875, approximately $140 per square foot. 212 N 19th St is a home located in Cattaraugus County with nearby schools including Olean Intermediate-Middle School, Olean Senior High School, and Southern Tier Catholic School.
Ownership History
Date
Name
Owned For
Owner Type
Purchase Details
Closed on
Oct 21, 2011
Sold by
Scroggins Gina
Bought by
Kunselman Robert
Current Estimated Value
Home Financials for this Owner
Home Financials are based on the most recent Mortgage that was taken out on this home.
Original Mortgage
$73,000
Interest Rate
4.11%
Mortgage Type
Purchase Money Mortgage
Purchase Details
Closed on
Aug 5, 2008
Sold by
Eddy Charles
Bought by
Scroggins Gina
Home Financials for this Owner
Home Financials are based on the most recent Mortgage that was taken out on this home.
Original Mortgage
$84,000
Interest Rate
6.49%
Mortgage Type
Purchase Money Mortgage
Purchase Details
Closed on
Sep 15, 2006
Sold by
Skinner Joey
Bought by
Eddy Charles
Purchase Details
Closed on
Jun 27, 2006
Sold by
County Of Cattaraugus
Bought by
Skinner Joey
Purchase Details
Closed on
Feb 28, 2006
Sold by
Kent Jean
Bought by
County Of Cattaraugus
Create a Home Valuation Report for This Property
The Home Valuation Report is an in-depth analysis detailing your home's value as well as a comparison with similar homes in the area
Home Values in the Area
Average Home Value in this Area
Purchase History
| Date | Buyer | Sale Price | Title Company |
|---|---|---|---|
| Kunselman Robert | $93,000 | Daniel R. Palumbo | |
| Scroggins Gina | $105,000 | Daniel Palumbo | |
| Eddy Charles | $20,000 | Greg Shemeld | |
| Skinner Joey | $13,000 | -- | |
| County Of Cattaraugus | -- | -- |
Source: Public Records
Mortgage History
| Date | Status | Borrower | Loan Amount |
|---|---|---|---|
| Closed | Kunselman Robert | $73,000 | |
| Previous Owner | Scroggins Gina | $84,000 |
Source: Public Records
Tax History Compared to Growth
Tax History
| Year | Tax Paid | Tax Assessment Tax Assessment Total Assessment is a certain percentage of the fair market value that is determined by local assessors to be the total taxable value of land and additions on the property. | Land | Improvement |
|---|---|---|---|---|
| 2024 | $6,607 | $104,500 | $6,300 | $98,200 |
| 2023 | $3,934 | $104,500 | $6,300 | $98,200 |
| 2022 | $3,991 | $104,500 | $6,300 | $98,200 |
| 2021 | $4,106 | $104,500 | $6,300 | $98,200 |
| 2020 | $4,135 | $104,500 | $6,300 | $98,200 |
| 2019 | $1,569 | $104,500 | $6,300 | $98,200 |
| 2018 | $5,637 | $104,500 | $6,300 | $98,200 |
| 2017 | $4,236 | $104,500 | $6,300 | $98,200 |
| 2016 | $4,190 | $104,500 | $6,300 | $98,200 |
| 2015 | -- | $104,500 | $6,300 | $98,200 |
| 2014 | -- | $104,500 | $6,300 | $98,200 |
Source: Public Records
Map
Nearby Homes