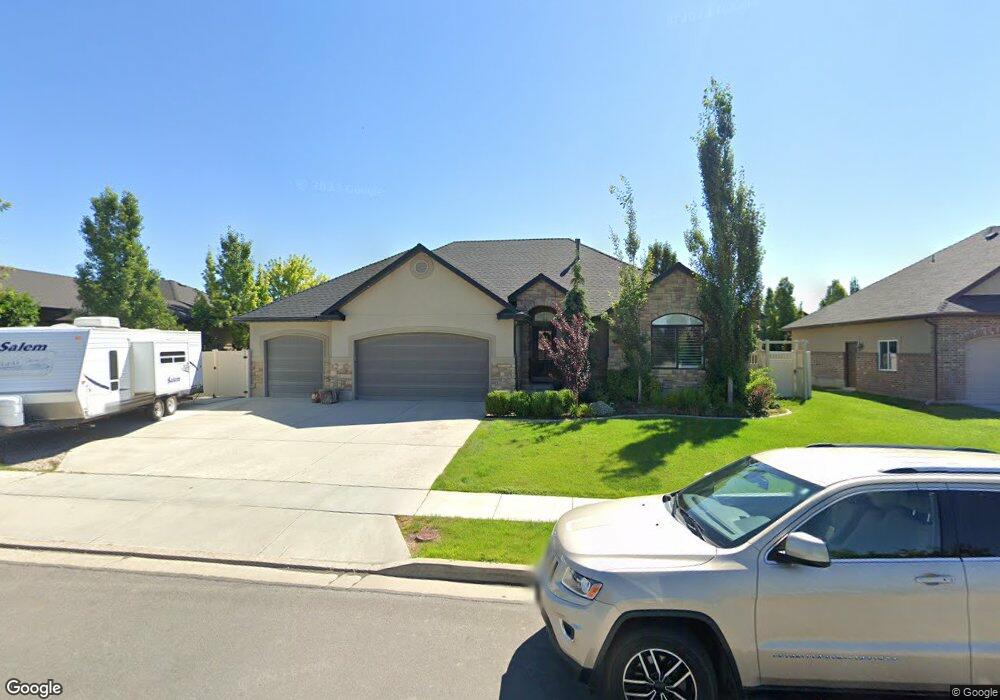
212 N 3675 W Layton, UT 84041
Estimated Value: $711,000 - $750,000
6
Beds
3
Baths
3,820
Sq Ft
$191/Sq Ft
Est. Value
About This Home
This home is located at 212 N 3675 W, Layton, UT 84041 and is currently estimated at $728,387, approximately $190 per square foot. 212 N 3675 W is a home located in Davis County with nearby schools including Sand Springs Elementary School, Legacy Junior High School, and Layton High School.
Ownership History
Date
Name
Owned For
Owner Type
Purchase Details
Closed on
Nov 23, 2020
Sold by
Page Jeffrey R
Bought by
Page Jeffrey R and Page Jennifer Lund
Current Estimated Value
Home Financials for this Owner
Home Financials are based on the most recent Mortgage that was taken out on this home.
Original Mortgage
$380,000
Outstanding Balance
$338,146
Interest Rate
2.8%
Mortgage Type
New Conventional
Estimated Equity
$390,241
Purchase Details
Closed on
Jun 28, 2016
Sold by
Kingston Trent and Kingston Shannon
Bought by
Page Jeffrey R
Purchase Details
Closed on
Oct 24, 2007
Sold by
Terraventure Development Ltd
Bought by
Kingston Trent and Kingston Shannon
Home Financials for this Owner
Home Financials are based on the most recent Mortgage that was taken out on this home.
Original Mortgage
$53,250
Interest Rate
6.27%
Mortgage Type
Credit Line Revolving
Create a Home Valuation Report for This Property
The Home Valuation Report is an in-depth analysis detailing your home's value as well as a comparison with similar homes in the area
Home Values in the Area
Average Home Value in this Area
Purchase History
We collect this data history from publicly available records. To have your information removed, we recommend requesting removal directly through your county’s website.
| Date | Buyer | Sale Price | Title Company |
|---|---|---|---|
| Page Jeffrey R | -- | Meridian Title Company | |
| Page Jeffrey R | -- | First American Title | |
| Kingston Trent | -- | Backman Title Services |
Source: Public Records
Mortgage History
We collect this data history from publicly available records. To have your information removed, we recommend requesting removal directly through your county’s website.
| Date | Status | Borrower | Loan Amount |
|---|---|---|---|
| Open | Page Jeffrey R | $380,000 | |
| Previous Owner | Kingston Trent | $53,250 | |
| Previous Owner | Kingston Trent | $284,000 |
Source: Public Records
Tax History
| Year | Tax Paid | Tax Assessment Tax Assessment Total Assessment is a certain percentage of the fair market value that is determined by local assessors to be the total taxable value of land and additions on the property. | Land | Improvement |
|---|---|---|---|---|
| 2025 | $3,699 | $388,300 | $119,150 | $269,150 |
| 2024 | $3,511 | $371,250 | $130,041 | $241,209 |
| 2023 | $3,423 | $638,000 | $132,225 | $505,775 |
| 2022 | $3,630 | $367,400 | $80,300 | $287,100 |
| 2021 | $3,332 | $503,000 | $120,458 | $382,542 |
| 2020 | $3,031 | $439,000 | $101,969 | $337,031 |
| 2019 | $2,947 | $418,000 | $103,173 | $314,827 |
| 2018 | $2,725 | $388,000 | $90,651 | $297,349 |
| 2016 | $2,392 | $175,725 | $36,354 | $139,371 |
| 2015 | $2,287 | $159,500 | $36,354 | $123,146 |
| 2014 | $2,032 | $144,866 | $36,354 | $108,512 |
| 2013 | -- | $166,369 | $38,823 | $127,546 |
Source: Public Records
Map
Nearby Homes
- 34 S 3600 W
- 15 N 3300 W
- 3535 W Overlook Dr
- 719 N 3500 W
- 3643 W 775 N
- 90 S Freedom Farms Dr
- 78 S Freedom Farms Dr
- 967 W Yamada Ct
- 3246 W 850 N Unit 114
- 1175 W Silver Hollow Rd
- 3266 W 850 N Unit 115
- 1125 W 3090 S
- 3562 S Bridgeview Ln
- 3580 S Clearwater Way
- 3047 S Old Emigrant Rd Unit C
- 2794 W Gentile St
- 921 W 2700 S
- 1097 N 3450 W
- 3250 W 1075 N
- 1457 W Waterfront Dr
- 198 N 3675 W
- 228 N 3675 W Unit 605
- 211 N 3600 W Unit 509
- 182 N 3675 W
- 240 N 3675 W Unit 606
- 240 N 3675 W
- 197 N 3600 W
- 197 N 3600 W Unit 508
- 209 N 3675 W
- 227 N 3600 W
- 225 N 3675 W
- 195 N 3675 W
- 181 N 3600 W
- 181 N 3600 W Unit 507
- 239 N 3675 W
- 239 N 3675 W Unit 607
- 1043 N 3675 W
- 241 N 3600 W
- 241 N 3600 W Unit 603
- 166 N 3675 W
Your Personal Tour Guide
Ask me questions while you tour the home.