Estimated Value: $51,000 - $75,000
3
Beds
1
Bath
1,259
Sq Ft
$52/Sq Ft
Est. Value
About This Home
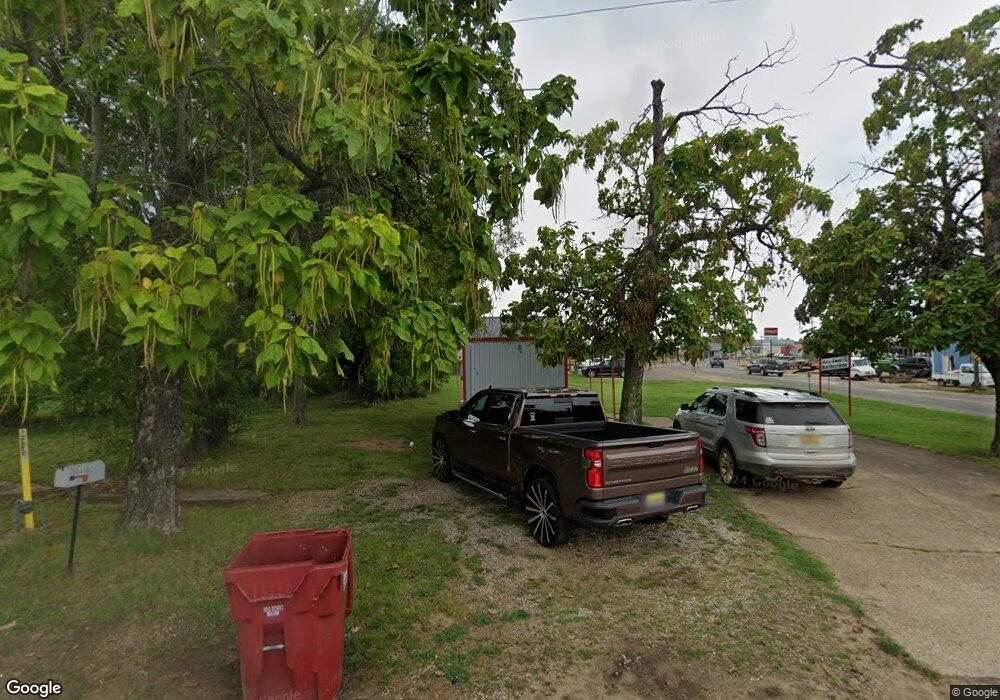
This home is located at 212 N E St, Hugo, OK 74743 and is currently estimated at $65,046, approximately $51 per square foot. 212 N E St is a home located in Choctaw County with nearby schools including Hugo Elementary School, Hugo Intermediate School, and Hugo Middle School.
Ownership History
Date
Name
Owned For
Owner Type
Purchase Details
Closed on
Nov 30, 2022
Sold by
Fuller Lynda R
Bought by
Cherry Cheri
Current Estimated Value
Home Financials for this Owner
Home Financials are based on the most recent Mortgage that was taken out on this home.
Original Mortgage
$59,895
Outstanding Balance
$58,038
Interest Rate
6.95%
Mortgage Type
FHA
Estimated Equity
$7,008
Purchase Details
Closed on
Nov 3, 2022
Sold by
Fuller Lynda R
Bought by
Madewell Lee and Madewell Barbara
Home Financials for this Owner
Home Financials are based on the most recent Mortgage that was taken out on this home.
Original Mortgage
$59,895
Outstanding Balance
$58,038
Interest Rate
6.95%
Mortgage Type
FHA
Estimated Equity
$7,008
Purchase Details
Closed on
Oct 27, 2021
Sold by
Fuller Lynda Ruth and Fuller Lynda
Bought by
Busby Philip
Purchase Details
Closed on
Apr 5, 2017
Sold by
Brown Kenda and Brown Kenda Lee
Bought by
Fuller Lynda Ruth
Create a Home Valuation Report for This Property
The Home Valuation Report is an in-depth analysis detailing your home's value as well as a comparison with similar homes in the area
Home Values in the Area
Average Home Value in this Area
Purchase History
| Date | Buyer | Sale Price | Title Company |
|---|---|---|---|
| Cherry Cheri | $61,000 | -- | |
| Madewell Lee | $70,000 | -- | |
| Busby Philip | $58,000 | Hugo Abstract & Title | |
| Fuller Lynda Ruth | $46,633 | None Available |
Source: Public Records
Mortgage History
| Date | Status | Borrower | Loan Amount |
|---|---|---|---|
| Open | Cherry Cheri | $59,895 |
Source: Public Records
Tax History
| Year | Tax Paid | Tax Assessment Tax Assessment Total Assessment is a certain percentage of the fair market value that is determined by local assessors to be the total taxable value of land and additions on the property. | Land | Improvement |
|---|---|---|---|---|
| 2025 | $334 | $4,007 | $289 | $3,718 |
| 2024 | $321 | $3,816 | $275 | $3,541 |
| 2023 | $321 | $6,710 | $220 | $6,490 |
| 2022 | $259 | $3,183 | $220 | $2,963 |
| 2021 | $246 | $3,032 | $220 | $2,812 |
| 2020 | $235 | $2,888 | $220 | $2,668 |
| 2019 | $225 | $2,750 | $220 | $2,530 |
| 2018 | $348 | $4,250 | $220 | $4,030 |
| 2017 | $420 | $5,070 | $1,087 | $3,983 |
| 2016 | $398 | $4,828 | $1,403 | $3,425 |
| 2015 | $357 | $4,310 | $1,100 | $3,210 |
| 2014 | $311 | $4,125 | $2,530 | $1,595 |
Source: Public Records
Map
Nearby Homes
- 109 W Victor St
- 504 N 5th St
- 601 N G St
- 1418 N Lambert St
- 805 W Clayton St
- 305 E Laurel St
- 701 W Oklahoma St
- 406 N J St
- 307 E Lowery St
- 1026 E Jefferson St
- 808 W Texas St
- 1414 E Kirk St
- 40 E 2010
- 308 E Highland St
- 911 S K St
- 2400 E 2080 Rd
- 1408 W Kiamichi St
- 2446 E Jackson St
- 1910 E Jackson St
- 1500 Roebuck Rd
Your Personal Tour Guide
Ask me questions while you tour the home.