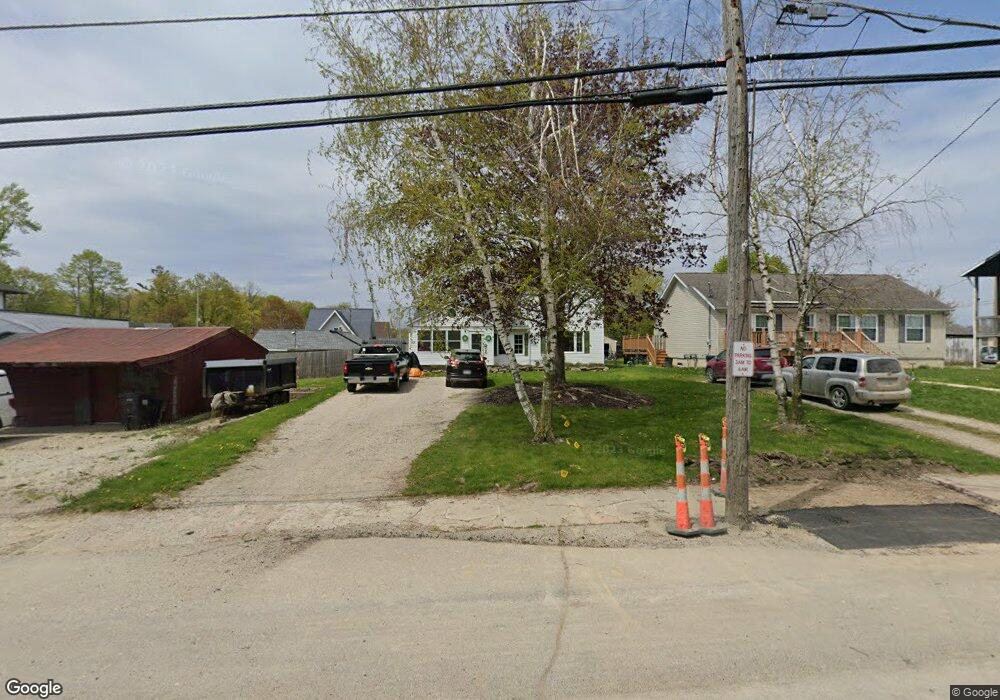
212 N Main St Unit MAIN Onsted, MI 49265
Estimated Value: $179,000 - $224,406
3
Beds
1
Bath
1,616
Sq Ft
$125/Sq Ft
Est. Value
About This Home
This home is located at 212 N Main St Unit MAIN, Onsted, MI 49265 and is currently estimated at $202,802, approximately $125 per square foot. 212 N Main St Unit MAIN is a home located in Lenawee County with nearby schools including Onsted Elementary School, Onsted Middle School, and Onsted Community High School.
Ownership History
Date
Name
Owned For
Owner Type
Purchase Details
Closed on
Jul 7, 2014
Sold by
Halcomb Robert L and Halcomb Jeannette L
Bought by
Smith Monica and Smith Thomas
Current Estimated Value
Home Financials for this Owner
Home Financials are based on the most recent Mortgage that was taken out on this home.
Original Mortgage
$68,732
Outstanding Balance
$52,762
Interest Rate
4.37%
Mortgage Type
FHA
Estimated Equity
$150,040
Purchase Details
Closed on
Apr 12, 2011
Sold by
Halcomb George W and Halcomb Dorothy L
Bought by
Halcomb Robert L and Halcomb Jeannette L
Purchase Details
Closed on
Mar 24, 2011
Sold by
Halcomb Robert L and Halcomb Jeannette L
Bought by
Halcomb George W and Halvomb Dorothy L
Purchase Details
Closed on
Oct 11, 2010
Sold by
Household Finance Corp Iii
Bought by
Halcomb Robert L and Halcomb Jeannette
Purchase Details
Closed on
Aug 12, 2010
Sold by
Hensley Lisa M
Bought by
Household Finance Corporation Iii
Create a Home Valuation Report for This Property
The Home Valuation Report is an in-depth analysis detailing your home's value as well as a comparison with similar homes in the area
Home Values in the Area
Average Home Value in this Area
Purchase History
| Date | Buyer | Sale Price | Title Company |
|---|---|---|---|
| Smith Monica | $70,000 | Title Source Inc | |
| Halcomb Robert L | -- | None Available | |
| Halcomb George W | -- | None Available | |
| Halcomb Robert L | $32,500 | None Available | |
| Household Finance Corporation Iii | $24,650 | None Available |
Source: Public Records
Mortgage History
| Date | Status | Borrower | Loan Amount |
|---|---|---|---|
| Open | Smith Monica | $68,732 |
Source: Public Records
Tax History Compared to Growth
Tax History
| Year | Tax Paid | Tax Assessment Tax Assessment Total Assessment is a certain percentage of the fair market value that is determined by local assessors to be the total taxable value of land and additions on the property. | Land | Improvement |
|---|---|---|---|---|
| 2025 | $1,339 | $65,800 | $0 | $0 |
| 2024 | $1,071 | $75,300 | $0 | $0 |
| 2022 | $2,452 | $55,800 | $0 | $0 |
| 2021 | $1,654 | $51,500 | $0 | $0 |
| 2020 | $1,599 | $52,100 | $0 | $0 |
| 2019 | $118,791 | $44,100 | $0 | $0 |
| 2018 | $2,196 | $44,129 | $0 | $0 |
| 2017 | $2,116 | $41,994 | $0 | $0 |
| 2016 | $2,116 | $40,245 | $0 | $0 |
| 2014 | -- | $43,541 | $0 | $0 |
Source: Public Records
Map
Nearby Homes
- 116 W Fourth St
- 409 Connor St
- Lot 8 Walsh Ct
- 8826 Irish Mist
- Lot 2 Walsh Ct
- 0 Castlebar Ln Unit 25054904
- 8810 W Stephenson Hwy
- 8000 Slee Rd
- 8812 Walsh Ct
- 8443 Stephenson Rd
- 7905 Wadding Dr
- 7831 Barron Ct
- 7966 Kingsley Dr
- 7604 Sherlock Dr
- 7596 Wadding Dr
- 10093 Shepherd Rd
- 7000 Surrey Dr
- 9160 Kingsley Dr
- 8861 Sussex Ct
- 8899 Sussex Ct