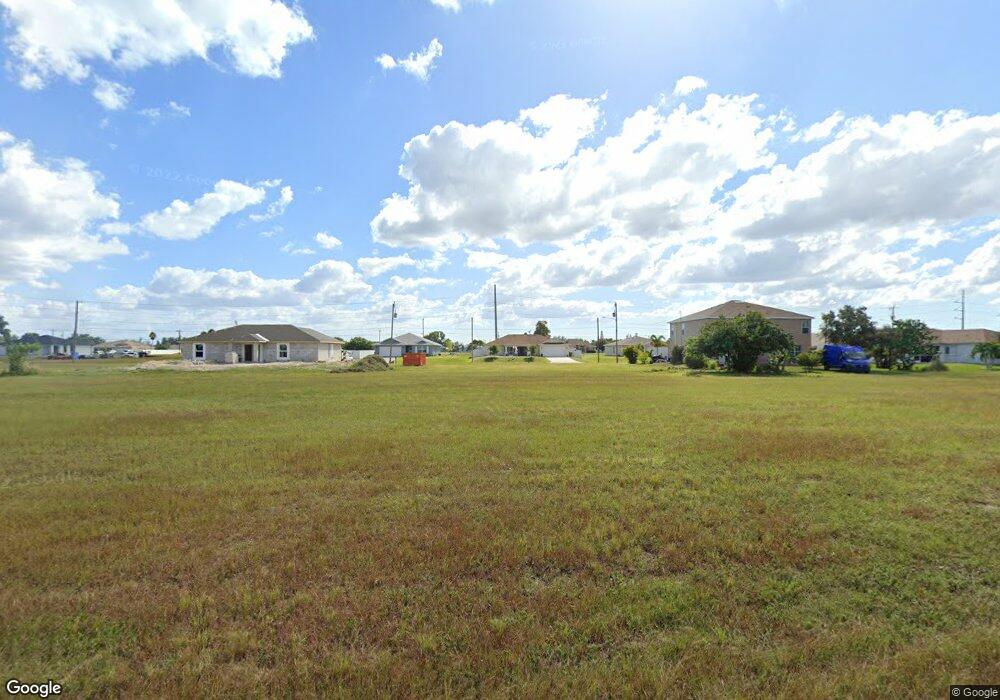
212 NE 25th St Cape Coral, FL 33909
Mariner NeighborhoodEstimated Value: $297,000 - $335,000
3
Beds
2
Baths
1,629
Sq Ft
$194/Sq Ft
Est. Value
About This Home
This home is located at 212 NE 25th St, Cape Coral, FL 33909 and is currently estimated at $315,232, approximately $193 per square foot. 212 NE 25th St is a home located in Lee County with nearby schools including Dr. Carrie D. Robinson Littleton Elementary School, Caloosa Elementary School, and Tropic Isles Elementary School.
Ownership History
Date
Name
Owned For
Owner Type
Purchase Details
Closed on
Sep 26, 2022
Sold by
Holiday Builders Inc
Bought by
Leger David Scott and Leger Katherine A
Current Estimated Value
Home Financials for this Owner
Home Financials are based on the most recent Mortgage that was taken out on this home.
Original Mortgage
$242,500
Outstanding Balance
$232,226
Interest Rate
5.55%
Mortgage Type
New Conventional
Estimated Equity
$83,006
Purchase Details
Closed on
Aug 28, 2020
Sold by
Florida Reserve Homes Llc
Bought by
Holiday Builders Inc
Purchase Details
Closed on
Jun 19, 2020
Sold by
The Kingdom Trust Company
Bought by
Florida Reserve Homes Llc
Purchase Details
Closed on
Aug 24, 2017
Sold by
Adam Land Invetments Llc
Bought by
The Kingdom Trust Company Custodian Fbo and Katie Bartlett Ira 1178540168
Purchase Details
Closed on
Jan 30, 2004
Sold by
Soos Donald J and Soos Sharon L
Bought by
Adam Land Inv L L C
Create a Home Valuation Report for This Property
The Home Valuation Report is an in-depth analysis detailing your home's value as well as a comparison with similar homes in the area
Home Values in the Area
Average Home Value in this Area
Purchase History
| Date | Buyer | Sale Price | Title Company |
|---|---|---|---|
| Leger David Scott | $250,000 | Hb Title | |
| Holiday Builders Inc | $56,500 | Hb Title | |
| Florida Reserve Homes Llc | $6,500 | Townsend Title Ins Agcy Llc | |
| The Kingdom Trust Company Custodian Fbo | $23,000 | Attorney | |
| Adam Land Inv L L C | $27,000 | -- |
Source: Public Records
Mortgage History
| Date | Status | Borrower | Loan Amount |
|---|---|---|---|
| Open | Leger David Scott | $242,500 |
Source: Public Records
Tax History Compared to Growth
Tax History
| Year | Tax Paid | Tax Assessment Tax Assessment Total Assessment is a certain percentage of the fair market value that is determined by local assessors to be the total taxable value of land and additions on the property. | Land | Improvement |
|---|---|---|---|---|
| 2025 | $4,526 | $280,867 | -- | -- |
| 2024 | $4,526 | $272,951 | $34,509 | $238,442 |
| 2023 | $5,573 | $340,738 | $31,590 | $184,865 |
| 2022 | $517 | $8,800 | $0 | $0 |
| 2021 | $505 | $8,000 | $8,000 | $0 |
| 2020 | $537 | $11,600 | $11,600 | $0 |
| 2019 | $560 | $14,000 | $14,000 | $0 |
| 2018 | $594 | $15,800 | $15,800 | $0 |
| 2017 | $490 | $11,951 | $11,951 | $0 |
| 2016 | $460 | $12,000 | $12,000 | $0 |
| 2015 | $447 | $14,500 | $14,500 | $0 |
| 2014 | -- | $11,100 | $11,100 | $0 |
| 2013 | -- | $7,600 | $7,600 | $0 |
Source: Public Records
Map
Nearby Homes
- 213 Kismet Pkwy E
- 209 Kismet Pkwy E
- 303 NE 25th St
- 204 NE 25th Terrace
- 315 NE 25th St
- 319 NE 25th St
- 318 NE 25th Terrace
- 2526 NE 2nd Place
- 111 Kismet Pkwy E
- 2521 NE 1st Place
- 205 NE 23rd St
- 2603 NE 2nd Place
- 314 NE 23rd Terrace
- 334 Kismet Pkwy E
- 2532 NE 1st Place
- 342 NE 25th Terrace
- 2602 NE 1st Place
- 26 NE 24th Terrace
- 109 NE 23rd St
- 331 NE 23rd St
- 206 NE 25th St
- 213 NE 24th Terrace
- 207 NE 24th Terrace
- 217 NE 24th Te
- 213 NE 25th St
- 209 NE 25th St
- 217 NE 25th St
- 203 NE 24th Terrace
- 221 NE 24th Terrace
- 221 NE 25th St
- 224 NE 25th St
- 134 NE 25th St Unit 17+18
- 201 NE 25th St
- 225 NE 24th Terrace
- 225 NE 24th Terrace Unit 32
- 210 NE 24th Terrace
- 210 NE 24th Terrace
- 133 NE 24th Terrace
- 214 NE 24th Terrace
- 225 NE 25th St Unit 36