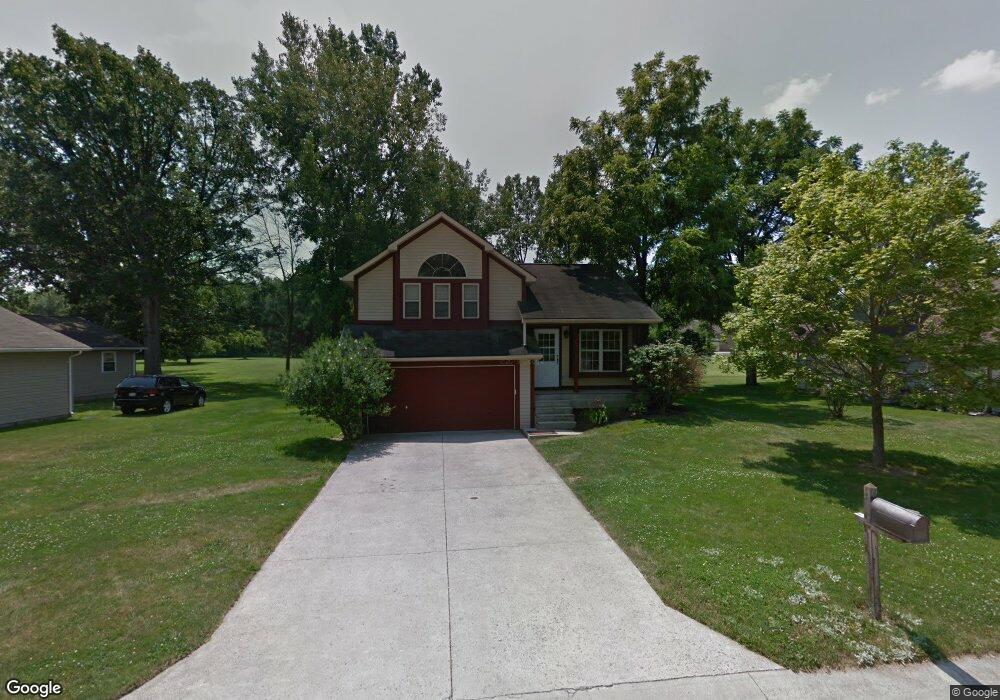
212 Oakcrest Ct Russells Point, OH 43348
Estimated Value: $196,441 - $258,000
3
Beds
2
Baths
1,338
Sq Ft
$178/Sq Ft
Est. Value
About This Home
This home is located at 212 Oakcrest Ct, Russells Point, OH 43348 and is currently estimated at $237,610, approximately $177 per square foot. 212 Oakcrest Ct is a home located in Logan County with nearby schools including Indian Lake Elementary School, Indian Lake Middle School, and Indian Lake High School.
Ownership History
Date
Name
Owned For
Owner Type
Purchase Details
Closed on
Dec 27, 2021
Sold by
Barnett Derek and Lynnsi Kathleen
Bought by
Bernett Berek and Barnett Lynnsi Kathleen
Current Estimated Value
Home Financials for this Owner
Home Financials are based on the most recent Mortgage that was taken out on this home.
Original Mortgage
$111,061
Interest Rate
3.85%
Mortgage Type
New Conventional
Purchase Details
Closed on
Nov 17, 2015
Sold by
Barber Austin D
Bought by
Barnett Derek
Home Financials for this Owner
Home Financials are based on the most recent Mortgage that was taken out on this home.
Original Mortgage
$118,808
Interest Rate
3.74%
Mortgage Type
FHA
Purchase Details
Closed on
Jul 1, 2014
Bought by
Barber Austin D
Purchase Details
Closed on
Mar 23, 2011
Sold by
Manion Minders Llc
Bought by
Pulfer Travis W and Pulfer Thomas W
Purchase Details
Closed on
Mar 14, 2011
Sold by
Ritter Dennis P and Ritter Sharon K
Bought by
Mansion Minders Llc
Create a Home Valuation Report for This Property
The Home Valuation Report is an in-depth analysis detailing your home's value as well as a comparison with similar homes in the area
Home Values in the Area
Average Home Value in this Area
Purchase History
| Date | Buyer | Sale Price | Title Company |
|---|---|---|---|
| Bernett Berek | -- | None Listed On Document | |
| Bernett Berek | -- | None Listed On Document | |
| Barnett Derek | $121,000 | Mad River Title Agency | |
| Barber Austin D | -- | -- | |
| Pulfer Travis W | -- | -- | |
| Mansion Minders Llc | -- | -- |
Source: Public Records
Mortgage History
| Date | Status | Borrower | Loan Amount |
|---|---|---|---|
| Previous Owner | Bernett Berek | $111,061 | |
| Previous Owner | Barnett Derek | $118,808 |
Source: Public Records
Tax History Compared to Growth
Tax History
| Year | Tax Paid | Tax Assessment Tax Assessment Total Assessment is a certain percentage of the fair market value that is determined by local assessors to be the total taxable value of land and additions on the property. | Land | Improvement |
|---|---|---|---|---|
| 2024 | $1,959 | $44,050 | $9,640 | $34,410 |
| 2023 | $1,959 | $44,050 | $9,640 | $34,410 |
| 2022 | $1,921 | $36,710 | $8,040 | $28,670 |
| 2021 | $1,817 | $36,710 | $8,040 | $28,670 |
| 2020 | $1,819 | $34,740 | $5,780 | $28,960 |
| 2019 | $1,816 | $34,740 | $5,780 | $28,960 |
| 2018 | $1,748 | $34,740 | $5,780 | $28,960 |
| 2016 | $1,561 | $33,360 | $5,780 | $27,580 |
| 2014 | $1,533 | $33,360 | $5,780 | $27,580 |
| 2013 | $1,451 | $33,360 | $5,780 | $27,580 |
| 2012 | $1,368 | $35,460 | $5,780 | $29,680 |
Source: Public Records
Map
Nearby Homes
- 224 Oakcrest Ct
- 206 White Oaks Ct
- 113 E Kress St
- 000 Miami Ave
- 422 Buckeye Ave
- 213 Russell St
- 222 Park Ave
- 6 Fun Dr
- 39 Fun Dr
- 202 Grand Ave
- 0 Maple Unit 1040900
- 0 Crystal Beach Island Unit 225020350
- 208 Clermont Ave
- 129 Chase Ave Unit 10-2U
- 129 Chase Ave Unit 9-2-L
- 129 Chase Ave Unit 11U
- 129 Chase Ave Unit 111U
- 285 N Orchard Island Rd Unit lot 66
- 129 Chase St Unit 21U
- 241 Chase Ave Unit A2L
- 216 Oakcrest Ct
- 208 Oakcrest Ct
- 11 Private Dr Artist
- 204 Oakcrest Ct
- 207 Oakcrest Ct
- 220 Oakcrest Ct
- 211 Oakcrest Ct
- 203 Oakcrest Ct
- 215 Oakcrest Ct
- 202 Oakcrest Ct
- 711 State Route 708
- 811 Ohio 708
- 210 White Oaks Ct
- 811 State Route 708
- 736 State Route 708
- 215 White Oaks Ct
- 712 Ohio 708
- 826 Ohio 708
- 826 S Orchard Island Rd
- 712 State Route 708