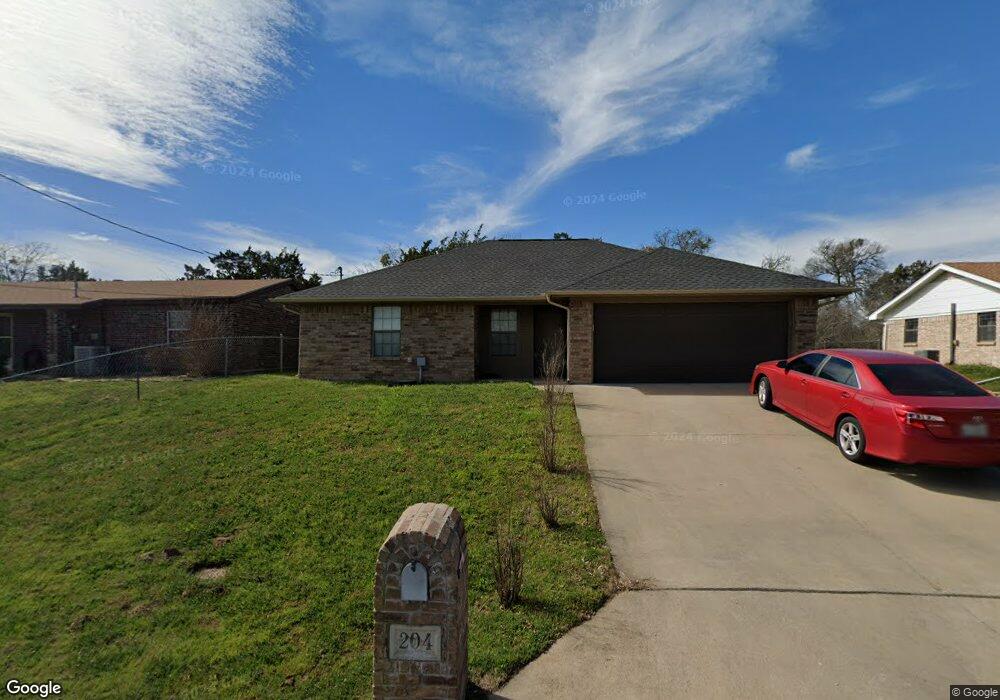
212 Park Ct Weatherford, TX 76086
Estimated Value: $287,420 - $322,000
3
Beds
2
Baths
1,640
Sq Ft
$186/Sq Ft
Est. Value
About This Home
This home is located at 212 Park Ct, Weatherford, TX 76086 and is currently estimated at $304,855, approximately $185 per square foot. 212 Park Ct is a home located in Parker County with nearby schools including Curtis Elementary School, Hall Middle School, and Weatherford High School.
Ownership History
Date
Name
Owned For
Owner Type
Purchase Details
Closed on
Feb 21, 2020
Sold by
Tdm Ventures Iv Llc
Bought by
Rhodes Cecil
Current Estimated Value
Home Financials for this Owner
Home Financials are based on the most recent Mortgage that was taken out on this home.
Original Mortgage
$134,400
Outstanding Balance
$119,002
Interest Rate
3.6%
Mortgage Type
New Conventional
Estimated Equity
$185,853
Purchase Details
Closed on
Mar 24, 2017
Sold by
Wichman Carroll J and Wichman Sharon
Bought by
Crosson William and Crosson Laci
Home Financials for this Owner
Home Financials are based on the most recent Mortgage that was taken out on this home.
Original Mortgage
$175,757
Interest Rate
5.25%
Mortgage Type
FHA
Purchase Details
Closed on
Apr 23, 2004
Sold by
Jesmain Jeffrey and Jesmain Nina
Bought by
Crosson William and Crosson Laci
Purchase Details
Closed on
Sep 25, 2000
Sold by
Williams Jesse C
Bought by
Crosson William and Crosson Laci
Create a Home Valuation Report for This Property
The Home Valuation Report is an in-depth analysis detailing your home's value as well as a comparison with similar homes in the area
Home Values in the Area
Average Home Value in this Area
Purchase History
| Date | Buyer | Sale Price | Title Company |
|---|---|---|---|
| Rhodes Cecil | -- | None Available | |
| Crosson William | -- | Sewell Title Co | |
| Crosson William | -- | -- | |
| Crosson William | -- | -- |
Source: Public Records
Mortgage History
| Date | Status | Borrower | Loan Amount |
|---|---|---|---|
| Open | Rhodes Cecil | $134,400 | |
| Previous Owner | Crosson William | $175,757 |
Source: Public Records
Tax History Compared to Growth
Tax History
| Year | Tax Paid | Tax Assessment Tax Assessment Total Assessment is a certain percentage of the fair market value that is determined by local assessors to be the total taxable value of land and additions on the property. | Land | Improvement |
|---|---|---|---|---|
| 2025 | $3,016 | $231,219 | -- | -- |
| 2024 | $3,016 | $210,199 | -- | -- |
| 2023 | $3,016 | $191,090 | $0 | $0 |
| 2022 | $3,853 | $173,720 | $40,000 | $133,720 |
| 2021 | $4,172 | $173,720 | $40,000 | $133,720 |
| 2020 | $4,197 | $173,720 | $40,000 | $133,720 |
| 2019 | $4,436 | $173,720 | $40,000 | $133,720 |
| 2018 | $4,572 | $178,260 | $40,000 | $138,260 |
| 2017 | $3,870 | $178,260 | $40,000 | $138,260 |
| 2016 | $3,518 | $133,700 | $15,600 | $118,100 |
| 2015 | $2,088 | $133,700 | $15,600 | $118,100 |
| 2014 | $2,231 | $127,810 | $15,600 | $112,210 |
Source: Public Records
Map
Nearby Homes
- 323 W Rentz St
- 208 W Park Ave
- 423 Live Oak Ln
- 1220 S Brazos St
- 209 S Hill Dr
- 1213 S Lamar St
- 102 Bob White Ave
- 1009 S Brazos St
- 918 El Dorado St
- 905 Eldorado St
- 1209 Lynn St
- 741 Nandina Rd
- 1813 Barberry Way
- 1816 Barberry
- 905 S Lamar St
- 904 S Brazos St
- 902 S Waco St
- 1101 Lynn St
- 824 S Alamo St
- 805 Trenton St