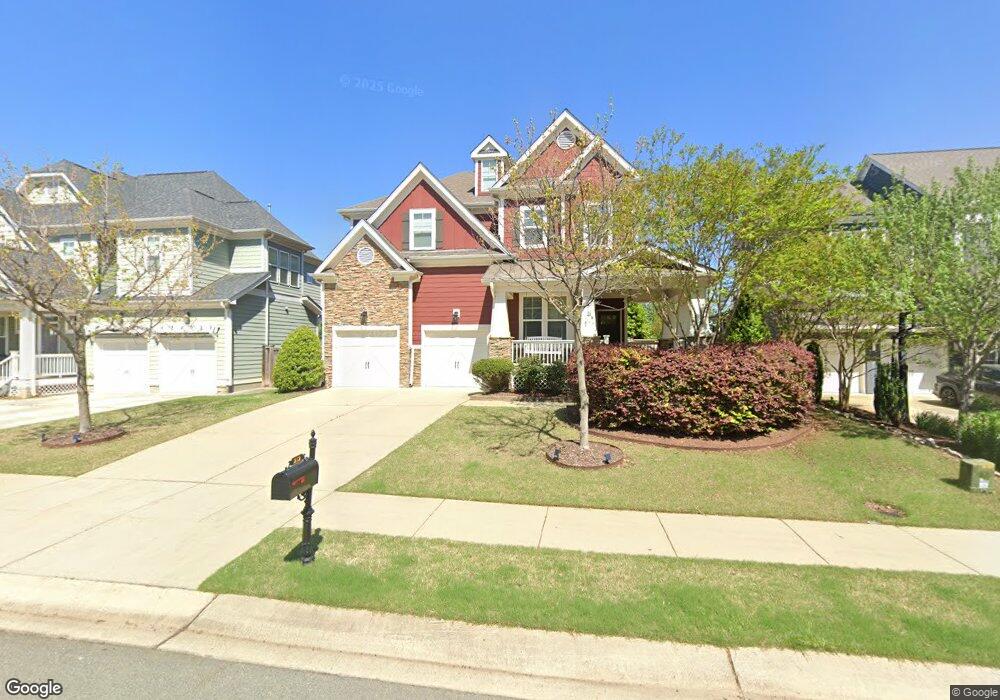
212 Pointe Park Cir Holly Springs, NC 27540
Estimated Value: $665,000 - $733,000
4
Beds
5
Baths
3,087
Sq Ft
$226/Sq Ft
Est. Value
About This Home
This home is located at 212 Pointe Park Cir, Holly Springs, NC 27540 and is currently estimated at $698,033, approximately $226 per square foot. 212 Pointe Park Cir is a home located in Wake County with nearby schools including Holly Grove Elementary School, Holly Grove Middle School, and Holly Springs High School.
Ownership History
Date
Name
Owned For
Owner Type
Purchase Details
Closed on
Jul 12, 2019
Sold by
Fales Ryan Scott and Fales Ryan
Bought by
Martin Adam Thomas and Martin Kayla Margaret
Current Estimated Value
Home Financials for this Owner
Home Financials are based on the most recent Mortgage that was taken out on this home.
Original Mortgage
$412,250
Outstanding Balance
$361,168
Interest Rate
3.82%
Mortgage Type
New Conventional
Estimated Equity
$336,865
Purchase Details
Closed on
May 17, 2013
Sold by
Garman Homes Llc
Bought by
Fales Ryan Scott and Fales Melanie Sue
Home Financials for this Owner
Home Financials are based on the most recent Mortgage that was taken out on this home.
Original Mortgage
$302,127
Interest Rate
3.56%
Mortgage Type
New Conventional
Purchase Details
Closed on
Jan 24, 2013
Sold by
Holly Pointe Llc
Bought by
Garman Homes Llc
Create a Home Valuation Report for This Property
The Home Valuation Report is an in-depth analysis detailing your home's value as well as a comparison with similar homes in the area
Home Values in the Area
Average Home Value in this Area
Purchase History
| Date | Buyer | Sale Price | Title Company |
|---|---|---|---|
| Martin Adam Thomas | $425,000 | None Available | |
| Fales Ryan Scott | -- | None Available | |
| Fales Ryan Scott | $318,500 | None Available | |
| Garman Homes Llc | $220,000 | None Available |
Source: Public Records
Mortgage History
| Date | Status | Borrower | Loan Amount |
|---|---|---|---|
| Open | Martin Adam Thomas | $412,250 | |
| Previous Owner | Fales Ryan Scott | $302,127 |
Source: Public Records
Tax History Compared to Growth
Tax History
| Year | Tax Paid | Tax Assessment Tax Assessment Total Assessment is a certain percentage of the fair market value that is determined by local assessors to be the total taxable value of land and additions on the property. | Land | Improvement |
|---|---|---|---|---|
| 2025 | $5,601 | $648,443 | $135,000 | $513,443 |
| 2024 | $5,577 | $648,443 | $135,000 | $513,443 |
| 2023 | $4,674 | $431,509 | $65,000 | $366,509 |
| 2022 | $4,512 | $431,509 | $65,000 | $366,509 |
| 2021 | $4,428 | $431,509 | $65,000 | $366,509 |
| 2020 | $4,428 | $431,509 | $65,000 | $366,509 |
| 2019 | $4,474 | $370,206 | $65,000 | $305,206 |
| 2018 | $4,044 | $370,206 | $65,000 | $305,206 |
| 2017 | $3,898 | $370,206 | $65,000 | $305,206 |
| 2016 | $3,844 | $370,206 | $65,000 | $305,206 |
| 2015 | $3,806 | $360,786 | $55,000 | $305,786 |
| 2014 | $3,675 | $360,786 | $55,000 | $305,786 |
Source: Public Records
Map
Nearby Homes
- 305 Tonks Trail
- 108 Pointe Park Cir
- 104 Pointe Park Cir
- 425 Cahors Trail
- 209 Devon Fields Dr
- 609 Ramsours Mill Dr
- 217 Alberta Pines Ct
- 101 Holly Thorn Trace
- Bedford Plan at Bridgeberry
- Hamilton Plan at Bridgeberry
- Ashford Plan at Bridgeberry
- Andrews Plan at Bridgeberry
- Sheridan Plan at Bridgeberry
- Wayland Plan at Bridgeberry
- 301 Salmonberry Dr
- 161 Summit Oaks Ln
- 100 Avent Pines Ln
- 113 Braxman Ln
- 6317 People Rd
- 505 Pyracantha Dr
- 212 Pointe Park Cir
- 216 Pointe Park Cir
- 208 Pointe Park Cir
- 204 Pointe Park Cir
- 220 Pointe Park Cir
- 229 Pointe Park Cir
- 401 Tonks Trail
- 225 Pointe Park Cir
- 405 Tonks Trail
- 409 Tonks Trail
- 309 Tonks Trail
- 237 Pointe Park Cir
- 413 Tonks Trail
- 213 Pointe Park Cir
- 301 Tonks Trail
- 241 Pointe Park Cir
- 417 Tonks Trail
- 213 Pointe Park Cir
- 209 Pointe Park Cir
- 245 Pointe Park Cir