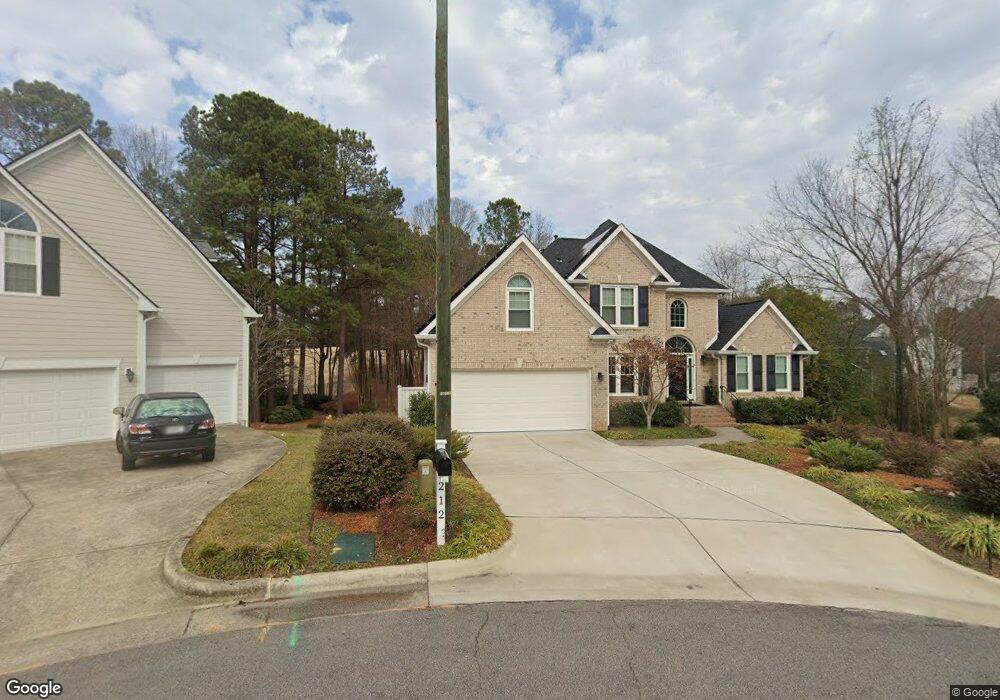
212 Preston Pines Dr Cary, NC 27513
Preston NeighborhoodEstimated Value: $778,000 - $882,000
4
Beds
4
Baths
2,703
Sq Ft
$308/Sq Ft
Est. Value
About This Home
This home is located at 212 Preston Pines Dr, Cary, NC 27513 and is currently estimated at $833,735, approximately $308 per square foot. 212 Preston Pines Dr is a home located in Wake County with nearby schools including Morrisville Elementary, Alston Ridge Middle School, and Green Hope High.
Ownership History
Date
Name
Owned For
Owner Type
Purchase Details
Closed on
May 15, 2019
Sold by
Edwards Ronald Charles and Edwards Stacie Lynne
Bought by
Mahnke Kai and Mahnke Ute
Current Estimated Value
Purchase Details
Closed on
Nov 4, 2016
Sold by
Marshall John W and Marshall Michelle C
Bought by
Edwards Ronald Charles and Edwards Stacie Lynn
Home Financials for this Owner
Home Financials are based on the most recent Mortgage that was taken out on this home.
Original Mortgage
$352,000
Interest Rate
3.42%
Mortgage Type
New Conventional
Purchase Details
Closed on
Jul 2, 1999
Sold by
Debrocky Theodore E and Debrocky Rose M
Bought by
Marshall John W and Marshall Michelle C
Home Financials for this Owner
Home Financials are based on the most recent Mortgage that was taken out on this home.
Original Mortgage
$140,000
Interest Rate
7.28%
Mortgage Type
Purchase Money Mortgage
Create a Home Valuation Report for This Property
The Home Valuation Report is an in-depth analysis detailing your home's value as well as a comparison with similar homes in the area
Home Values in the Area
Average Home Value in this Area
Purchase History
| Date | Buyer | Sale Price | Title Company |
|---|---|---|---|
| Mahnke Kai | $493,500 | None Available | |
| Edwards Ronald Charles | $452,500 | None Available | |
| Marshall John W | $280,500 | -- |
Source: Public Records
Mortgage History
| Date | Status | Borrower | Loan Amount |
|---|---|---|---|
| Previous Owner | Edwards Ronald Charles | $352,000 | |
| Previous Owner | Marshall John W | $140,000 |
Source: Public Records
Tax History Compared to Growth
Tax History
| Year | Tax Paid | Tax Assessment Tax Assessment Total Assessment is a certain percentage of the fair market value that is determined by local assessors to be the total taxable value of land and additions on the property. | Land | Improvement |
|---|---|---|---|---|
| 2025 | $6,333 | $736,544 | $295,000 | $441,544 |
| 2024 | $6,196 | $736,544 | $295,000 | $441,544 |
| 2023 | $4,862 | $483,213 | $160,000 | $323,213 |
| 2022 | $4,681 | $483,213 | $160,000 | $323,213 |
| 2021 | $4,586 | $483,213 | $160,000 | $323,213 |
| 2020 | $4,611 | $483,213 | $160,000 | $323,213 |
| 2019 | $4,541 | $422,242 | $155,000 | $267,242 |
| 2018 | $4,261 | $422,242 | $155,000 | $267,242 |
| 2017 | $4,095 | $422,242 | $155,000 | $267,242 |
| 2016 | $4,033 | $417,788 | $155,000 | $262,788 |
| 2015 | $3,761 | $379,983 | $120,000 | $259,983 |
| 2014 | $3,546 | $379,983 | $120,000 | $259,983 |
Source: Public Records
Map
Nearby Homes
- 112 Glen Abbey Dr
- 217 Preston Retreat Ln
- 101 Turquoise Creek Dr
- 107 Ethans Glen Ct
- 2737 Davis Dr
- 104 Deerwalk Ct
- 103 Farrell Ct
- 3322 Kudrow Ln Unit 3322
- 3312 Kudrow Ln Unit 3312
- 3523 Kudrow Ln Unit 3523
- 1511 Kudrow Ln Unit 1511B
- 320 Madres Ln
- 1058 Kingston Grove Dr
- 1114 Bondhu Place
- 104 Natchez Ct
- 306 Kirkeenan Cir
- 113 Beeley Ct
- 102 Revere Forest Ct
- 502 Kirkeenan Cir
- 212 Torrey Pines Dr
- 217 Preston Pines Dr
- 110 W Clarksville Ct
- 109 W Clarksville Ct
- 109 Sir James Ct
- 208 Preston Pines Dr
- 215 Preston Pines Dr
- 213 Preston Pines Dr
- 108 W Clarksville Ct
- 211 Preston Pines Dr
- 206 Preston Pines Dr
- 108 Sir James Ct
- 107 W Clarksville Ct
- 1O7 Sir James Ct
- 105 Sir James Ct
- 209 Preston Pines Dr
- 108 Wybel Ln
- 106 W Clarksville Ct
- 204 Preston Pines Dr
- 105 W Clarksville Ct
- 207 Preston Pines Dr