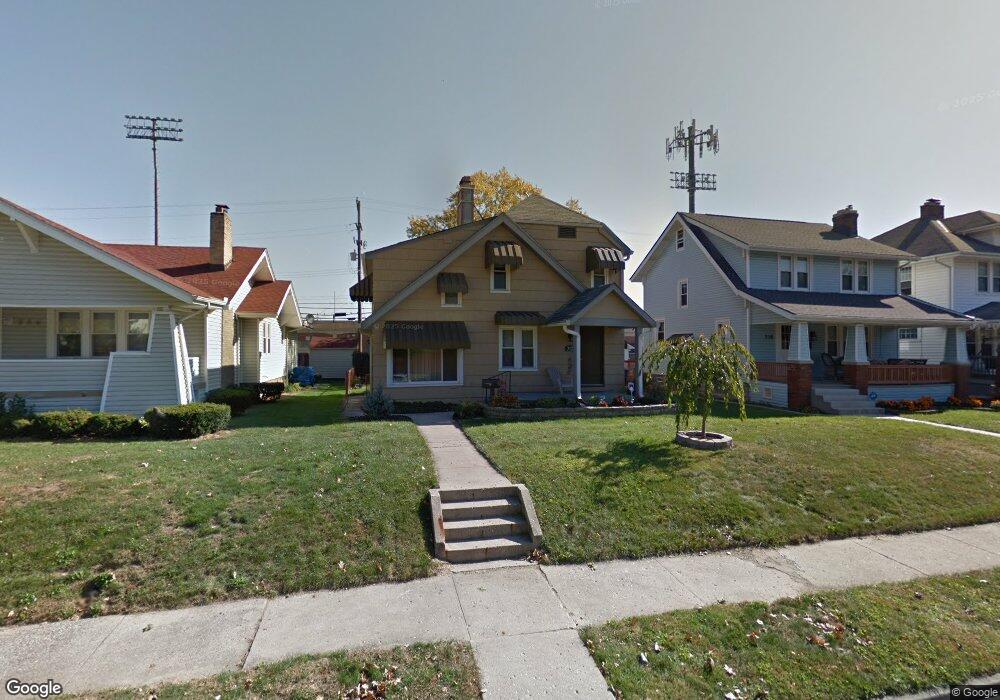
212 S Roys Ave Columbus, OH 43204
Westgate NeighborhoodEstimated Value: $201,000 - $284,000
3
Beds
1
Bath
1,516
Sq Ft
$164/Sq Ft
Est. Value
About This Home
This home is located at 212 S Roys Ave, Columbus, OH 43204 and is currently estimated at $248,282, approximately $163 per square foot. 212 S Roys Ave is a home located in Franklin County with nearby schools including Westgate Alternative Elementary School, Westmoor Middle School, and West High School.
Ownership History
Date
Name
Owned For
Owner Type
Purchase Details
Closed on
Nov 14, 2011
Sold by
Secretary Of Housing & Urban Development
Bought by
Kilgore Michael
Current Estimated Value
Purchase Details
Closed on
Jun 20, 2011
Sold by
Wells Fargo Bank Na
Bought by
Secretary Of Housing & Urban Development
Purchase Details
Closed on
May 25, 2011
Sold by
Cohn Jason and Cohn Jessica
Bought by
Wells Fargo Bank Na
Purchase Details
Closed on
Jun 12, 2006
Sold by
Culp Delmas J
Bought by
Cohn Jason and Cohn Jessica
Home Financials for this Owner
Home Financials are based on the most recent Mortgage that was taken out on this home.
Original Mortgage
$116,876
Interest Rate
6.68%
Mortgage Type
FHA
Purchase Details
Closed on
Feb 15, 1984
Bought by
Culp Delmas J
Purchase Details
Closed on
Oct 1, 1981
Create a Home Valuation Report for This Property
The Home Valuation Report is an in-depth analysis detailing your home's value as well as a comparison with similar homes in the area
Home Values in the Area
Average Home Value in this Area
Purchase History
| Date | Buyer | Sale Price | Title Company |
|---|---|---|---|
| Kilgore Michael | $29,000 | Attorney | |
| Secretary Of Housing & Urban Development | -- | None Available | |
| Wells Fargo Bank Na | $54,000 | None Available | |
| Cohn Jason | $117,800 | Title Agenc | |
| Culp Delmas J | $39,800 | -- | |
| -- | $38,500 | -- |
Source: Public Records
Mortgage History
| Date | Status | Borrower | Loan Amount |
|---|---|---|---|
| Previous Owner | Cohn Jason | $116,876 |
Source: Public Records
Tax History Compared to Growth
Tax History
| Year | Tax Paid | Tax Assessment Tax Assessment Total Assessment is a certain percentage of the fair market value that is determined by local assessors to be the total taxable value of land and additions on the property. | Land | Improvement |
|---|---|---|---|---|
| 2024 | $7,382 | $78,680 | $20,580 | $58,100 |
| 2023 | $3,486 | $78,680 | $20,580 | $58,100 |
| 2022 | $7,238 | $43,680 | $6,580 | $37,100 |
| 2021 | $2,270 | $43,680 | $6,580 | $37,100 |
| 2020 | $2,272 | $43,680 | $6,580 | $37,100 |
| 2019 | $2,223 | $36,650 | $5,500 | $31,150 |
| 2018 | $2,135 | $36,650 | $5,500 | $31,150 |
| 2017 | $2,222 | $36,650 | $5,500 | $31,150 |
| 2016 | $2,259 | $34,100 | $7,600 | $26,500 |
| 2015 | $2,051 | $34,100 | $7,600 | $26,500 |
| 2014 | $2,056 | $34,100 | $7,600 | $26,500 |
| 2013 | $1,126 | $37,870 | $8,435 | $29,435 |
Source: Public Records
Map
Nearby Homes
- 261 S Chase Ave
- 227 S Hague Ave
- 2845 Fremont St
- 327 S Chase Ave
- 339 S Powell Ave
- 363 S Chase Ave
- 235 S Harris Ave
- 58 Binns Blvd
- 65 S Hague Ave
- 262 S Harris Ave
- 2710 Palmetto St
- 406 S Hague Ave Unit 6
- 267 S Westgate Ave
- 389 S Harris Ave
- 85 S Warren Ave
- 219 S Ogden Ave
- 438 S Powell Ave
- 334 S Warren Ave
- 457 Guernsey Ave
- 0 S Brinker Ave
- 218 S Roys Ave
- 206 S Roys Ave
- 222 S Roys Ave
- 228 S Roys Ave
- 2915 Palmetto St
- 234 S Roys Ave
- 190 S Roys Ave
- 223 S Roys Ave
- 238 S Roys Ave
- 182 S Roys Ave
- 229 S Roys Ave
- 2925 Palmetto St
- 191 S Roys Ave
- 244 S Roys Ave
- 235 S Roys Ave
- 178 S Roys Ave
- 181 S Roys Ave
- 2929 Palmetto St
- 241 S Roys Ave
- 172 S Roys Ave