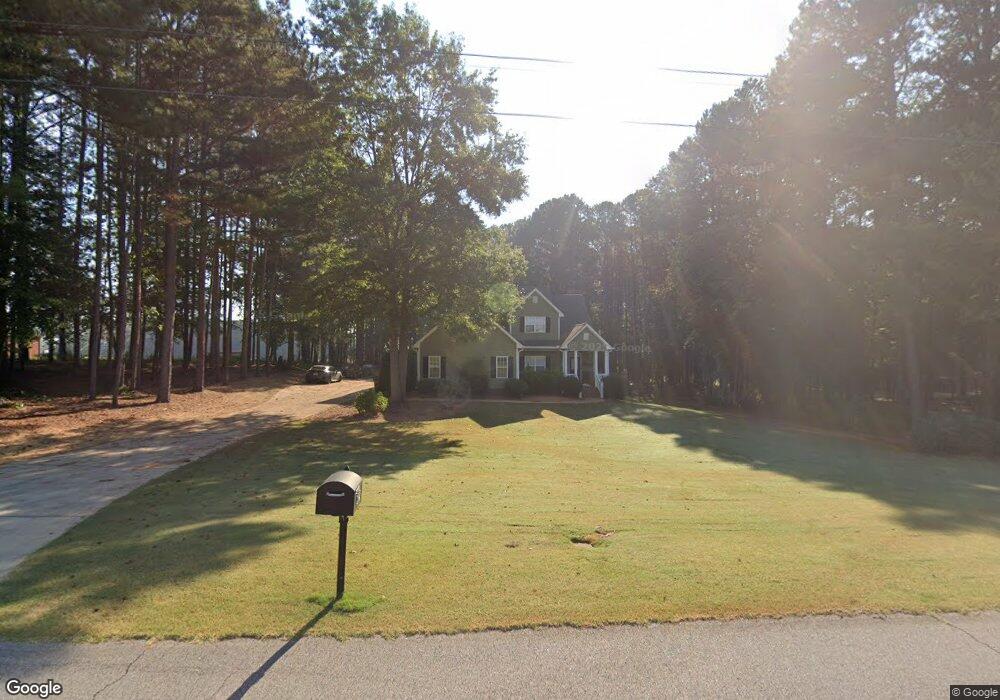
212 Seabolt Way Carrollton, GA 30117
Estimated Value: $453,000 - $530,000
3
Beds
3
Baths
2,337
Sq Ft
$207/Sq Ft
Est. Value
About This Home
This home is located at 212 Seabolt Way, Carrollton, GA 30117 and is currently estimated at $484,029, approximately $207 per square foot. 212 Seabolt Way is a home located in Carroll County with nearby schools including Roopville Elementary School, Central Middle School, and Central High School.
Ownership History
Date
Name
Owned For
Owner Type
Purchase Details
Closed on
Nov 7, 2017
Sold by
Powers Donald P
Bought by
Byrge Heather L and Byrge James Gregory
Current Estimated Value
Home Financials for this Owner
Home Financials are based on the most recent Mortgage that was taken out on this home.
Original Mortgage
$208,000
Outstanding Balance
$174,156
Interest Rate
3.91%
Mortgage Type
New Conventional
Estimated Equity
$309,873
Purchase Details
Closed on
May 31, 2014
Sold by
Powers Donald P and Powers Linda D
Bought by
Powers Donald P
Purchase Details
Closed on
Mar 26, 2004
Sold by
Deberry James J
Bought by
Powers Donald P and Powers Linda D
Purchase Details
Closed on
Jul 30, 2003
Sold by
Seabolt M Wayne
Bought by
Deberry James J
Purchase Details
Closed on
Jul 11, 1999
Bought by
Seabolt M Wayne
Create a Home Valuation Report for This Property
The Home Valuation Report is an in-depth analysis detailing your home's value as well as a comparison with similar homes in the area
Home Values in the Area
Average Home Value in this Area
Purchase History
| Date | Buyer | Sale Price | Title Company |
|---|---|---|---|
| Byrge Heather L | $260,000 | -- | |
| Powers Donald P | -- | -- | |
| Powers Donald P | $224,000 | -- | |
| Deberry James J | $39,000 | -- | |
| Seabolt M Wayne | -- | -- |
Source: Public Records
Mortgage History
| Date | Status | Borrower | Loan Amount |
|---|---|---|---|
| Open | Byrge Heather L | $208,000 |
Source: Public Records
Tax History Compared to Growth
Tax History
| Year | Tax Paid | Tax Assessment Tax Assessment Total Assessment is a certain percentage of the fair market value that is determined by local assessors to be the total taxable value of land and additions on the property. | Land | Improvement |
|---|---|---|---|---|
| 2024 | $3,713 | $164,127 | $25,608 | $138,519 |
| 2023 | $3,713 | $151,621 | $25,608 | $126,013 |
| 2022 | $3,179 | $126,766 | $25,608 | $101,158 |
| 2021 | $2,878 | $112,251 | $25,608 | $86,643 |
| 2020 | $2,647 | $103,132 | $25,608 | $77,524 |
| 2019 | $2,484 | $95,974 | $25,608 | $70,366 |
| 2018 | $2,346 | $89,340 | $25,608 | $63,732 |
| 2017 | $679 | $89,340 | $25,608 | $63,732 |
| 2016 | $679 | $89,340 | $25,608 | $63,732 |
| 2015 | $694 | $90,468 | $13,968 | $76,501 |
| 2014 | $2,428 | $90,469 | $13,968 | $76,501 |
Source: Public Records
Map
Nearby Homes
- 4144 Tyus Carrollton Rd
- 0 Needmore Rd Unit (345 37 Acres)
- 4228 Tyus Carrollton Rd
- 1358 W 5 Hwy
- TRACT 2 Attaway Rd Unit TRACT 4.59 ACRES
- Tract 1 Attaway Road Tract 4 15 Acres Unit 185
- TRACT 1 Attaway Rd Unit 4.15 ACRES
- 0 Needmore Road- (345 37 Acres)
- 0 Needmore Rd Unit (345.37 ACRES)
- 1187 Attaway Rd
- 1629 Bethesda Church Rd
- 1611 Bethesda Church Rd
- 1593 Bethesda Church Rd
- 1575 Bethesda Church Rd
- TRACT 2 Attaway Road Tract 4 59 Acres Unit 185
- 450 Baxter Rd
- 537 Craven Rd
- 534 Craven Rd
- 534 Craven Rd Unit 137
- 630 Stoney Point Rd
- 226 Seabolt Way
- 198 Seabolt Way
- 184 Seabolt Way
- 240 Seabolt Way
- 241 Seabolt Way
- 171 Seabolt Way
- 170 Seabolt Way
- 170 Seabolt Way Unit 4,5
- 0 Seabolt Way
- 157 Seabolt Way
- 143 Seabolt Way
- 129 Seabolt Way
- 2749 Bethesda Church Rd
- 125 Seabolt Way
- 128 Seabolt Way
- 2788 Bethesda Church Rd
- 2805 Bethesda Church Rd
- 2593 Bethesda Church Rd
- 1585 W Highway 5
- 2794 Bethesda Church Rd