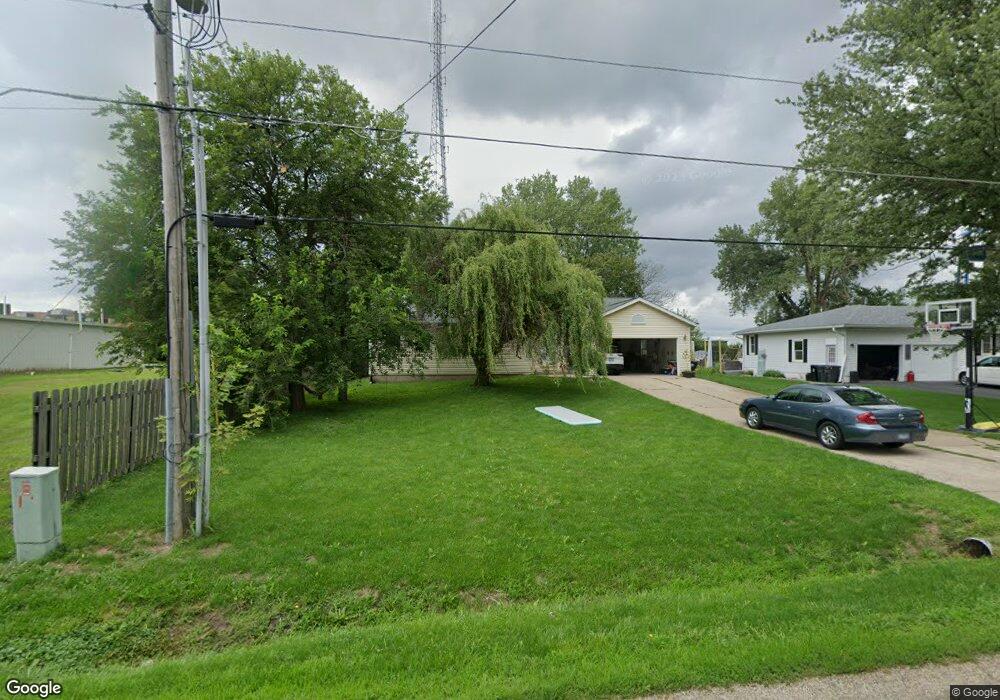
212 Sheffield Rd Groveland, IL 61535
Estimated Value: $225,000 - $243,000
4
Beds
2
Baths
1,536
Sq Ft
$152/Sq Ft
Est. Value
About This Home
This home is located at 212 Sheffield Rd, Groveland, IL 61535 and is currently estimated at $234,158, approximately $152 per square foot. 212 Sheffield Rd is a home located in Tazewell County with nearby schools including Morton High School, Blessed Sacrament School, and Bethel Lutheran School.
Ownership History
Date
Name
Owned For
Owner Type
Purchase Details
Closed on
Jun 28, 2013
Sold by
Casey Lisa K
Bought by
Lenning Chad L and Lenning Sarah N
Current Estimated Value
Home Financials for this Owner
Home Financials are based on the most recent Mortgage that was taken out on this home.
Original Mortgage
$142,800
Outstanding Balance
$103,617
Interest Rate
3.87%
Mortgage Type
New Conventional
Estimated Equity
$130,541
Purchase Details
Closed on
Jun 29, 2010
Sold by
Smith Joan M
Bought by
Casey Lisa K
Purchase Details
Closed on
Jul 27, 2006
Sold by
Knollenberg Leslie J
Bought by
Smith Joan M
Purchase Details
Closed on
May 9, 2006
Sold by
Rubbert Betty J
Bought by
Knollenberg Leslie J
Purchase Details
Closed on
Mar 24, 2006
Sold by
Rubbert William G
Bought by
Rubbert Betty J
Create a Home Valuation Report for This Property
The Home Valuation Report is an in-depth analysis detailing your home's value as well as a comparison with similar homes in the area
Home Values in the Area
Average Home Value in this Area
Purchase History
| Date | Buyer | Sale Price | Title Company |
|---|---|---|---|
| Lenning Chad L | $160,000 | Riverland Title Inc | |
| Casey Lisa K | -- | None Available | |
| Smith Joan M | $149,000 | First Community Title Svcs | |
| Knollenberg Leslie J | $134,500 | First Community Title Svcs | |
| Rubbert Betty J | -- | None Available |
Source: Public Records
Mortgage History
| Date | Status | Borrower | Loan Amount |
|---|---|---|---|
| Open | Lenning Chad L | $142,800 |
Source: Public Records
Tax History Compared to Growth
Tax History
| Year | Tax Paid | Tax Assessment Tax Assessment Total Assessment is a certain percentage of the fair market value that is determined by local assessors to be the total taxable value of land and additions on the property. | Land | Improvement |
|---|---|---|---|---|
| 2024 | $3,682 | $63,110 | $4,760 | $58,350 |
| 2023 | $3,682 | $57,940 | $4,370 | $53,570 |
| 2022 | $3,544 | $53,590 | $4,040 | $49,550 |
| 2021 | $3,387 | $51,520 | $3,880 | $47,640 |
| 2020 | $3,295 | $51,520 | $3,880 | $47,640 |
| 2019 | $3,288 | $51,520 | $3,880 | $47,640 |
| 2018 | $3,227 | $51,520 | $3,880 | $47,640 |
| 2017 | $3,144 | $49,910 | $3,760 | $46,150 |
| 2016 | $3,110 | $49,910 | $3,760 | $46,150 |
| 2015 | $3,004 | $0 | $0 | $0 |
| 2013 | $2,975 | $49,910 | $3,760 | $46,150 |
Source: Public Records
Map
Nearby Homes
- 19478 Springfield Rd
- 19314 Springfield Rd
- 101 Apache Way
- 105 Apache Way
- 417 Apache Way
- 109 Apache Way
- 105 Sheffield Rd
- 123 Apache Way
- 305 Apache Way
- 210 Apache Way
- 4851 Sheridan Rd
- 305 Conaghan Dr
- 015 Harris Rd
- Lot 4 Harris Rd
- 0 Pinecrest Dr
- 301 Briarbrook Dr
- Lot 1 Briarbrook Dr
- Lot 2 Briarbrook Dr
- 110 Susan Ct
- 118 Susan Ct
- 214 Sheffield Rd
- 217 Sheffield Rd
- 218 Sheffield Rd
- 205 Sheffield Rd
- 220 Sheffield Rd
- 19358 Springfield Rd
- 224 Sheffield Rd
- 229 Sheffield Rd
- 147 Sheffield Rd
- 226 Sheffield Rd
- 19348 Springfield Rd
- 235 Sheffield Rd
- 230 Sheffield Rd
- 0 Springfield Rd
- 19383 Springfield Rd
- 19369 Springfield Rd
- 232 Sheffield Rd
- 143 Sheffield Rd
- 144 Sheffield Rd