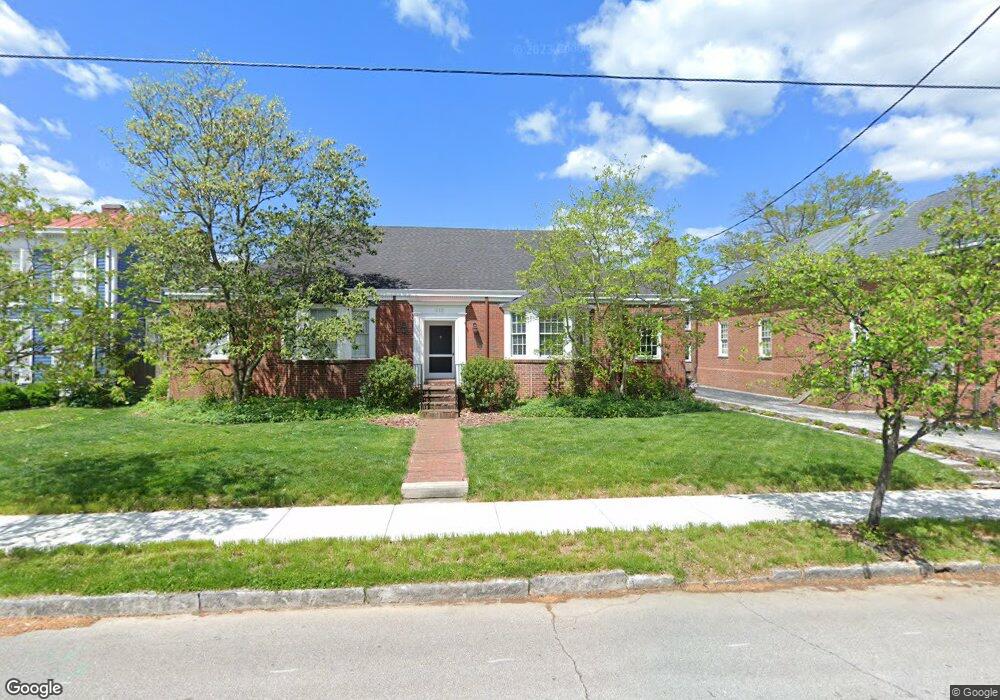
212 Shelby St Frankfort, KY 40601
Estimated Value: $437,665
3
Beds
3
Baths
3,600
Sq Ft
$122/Sq Ft
Est. Value
About This Home
This home is located at 212 Shelby St, Frankfort, KY 40601 and is currently estimated at $437,665, approximately $121 per square foot. 212 Shelby St is a home located in Franklin County with nearby schools including Second Street School, Frankfort High School, and Capital Day School.
Ownership History
Date
Name
Owned For
Owner Type
Purchase Details
Closed on
Jul 3, 2021
Sold by
York Hershael W and York Tanya K
Bought by
York Hershael W and York Tanya K
Current Estimated Value
Home Financials for this Owner
Home Financials are based on the most recent Mortgage that was taken out on this home.
Original Mortgage
$167,000
Outstanding Balance
$125,958
Interest Rate
2.9%
Mortgage Type
New Conventional
Estimated Equity
$311,707
Purchase Details
Closed on
Apr 18, 2008
Sold by
Maddox Henry and Maddox Mildred Wiley
Bought by
York Hershael W and York Tonya K
Home Financials for this Owner
Home Financials are based on the most recent Mortgage that was taken out on this home.
Original Mortgage
$216,601
Interest Rate
5.84%
Mortgage Type
FHA
Create a Home Valuation Report for This Property
The Home Valuation Report is an in-depth analysis detailing your home's value as well as a comparison with similar homes in the area
Home Values in the Area
Average Home Value in this Area
Purchase History
| Date | Buyer | Sale Price | Title Company |
|---|---|---|---|
| York Hershael W | -- | None Available | |
| York Hershael W | $220,000 | Capital Title Llc |
Source: Public Records
Mortgage History
| Date | Status | Borrower | Loan Amount |
|---|---|---|---|
| Open | York Hershael W | $167,000 | |
| Closed | York Hershael W | $216,601 |
Source: Public Records
Tax History Compared to Growth
Tax History
| Year | Tax Paid | Tax Assessment Tax Assessment Total Assessment is a certain percentage of the fair market value that is determined by local assessors to be the total taxable value of land and additions on the property. | Land | Improvement |
|---|---|---|---|---|
| 2025 | $871 | $240,000 | $0 | $0 |
| 2024 | $1,118 | $240,000 | $0 | $0 |
| 2023 | $1,138 | $240,000 | $0 | $0 |
| 2022 | $2,909 | $240,000 | $0 | $0 |
| 2021 | $1,142 | $240,000 | $0 | $0 |
| 2020 | $1,059 | $220,000 | $25,000 | $195,000 |
| 2019 | $1,060 | $220,000 | $25,000 | $195,000 |
| 2018 | $1,082 | $220,000 | $25,000 | $195,000 |
| 2017 | $2,405 | $220,000 | $25,000 | $195,000 |
| 2016 | $1,026 | $220,000 | $25,000 | $195,000 |
| 2015 | $3,003 | $220,000 | $25,000 | $195,000 |
| 2011 | $3,003 | $220,000 | $25,000 | $195,000 |
Source: Public Records
Map
Nearby Homes
- 312 Conway St
- 316 Logan St
- 214 W Campbell St
- 218 W Campbell St
- 396 Ewing St
- 311 Second E St
- 212 Washington St
- 205 Paul Sawyier Dr
- 207 Paul Sawyier Dr
- 413 W Broadway St
- 1121 Leawood Dr
- 519 Ann St
- 1127 Leawood Dr
- 501 W Broadway St
- 733 Woodland Ave
- 2033 Berry Hill Dr
- 1119 Leawood Dr
- 1111 Leawood Dr
- 1109 Leawood Dr Unit 1109
- 1106 Leawood Dr