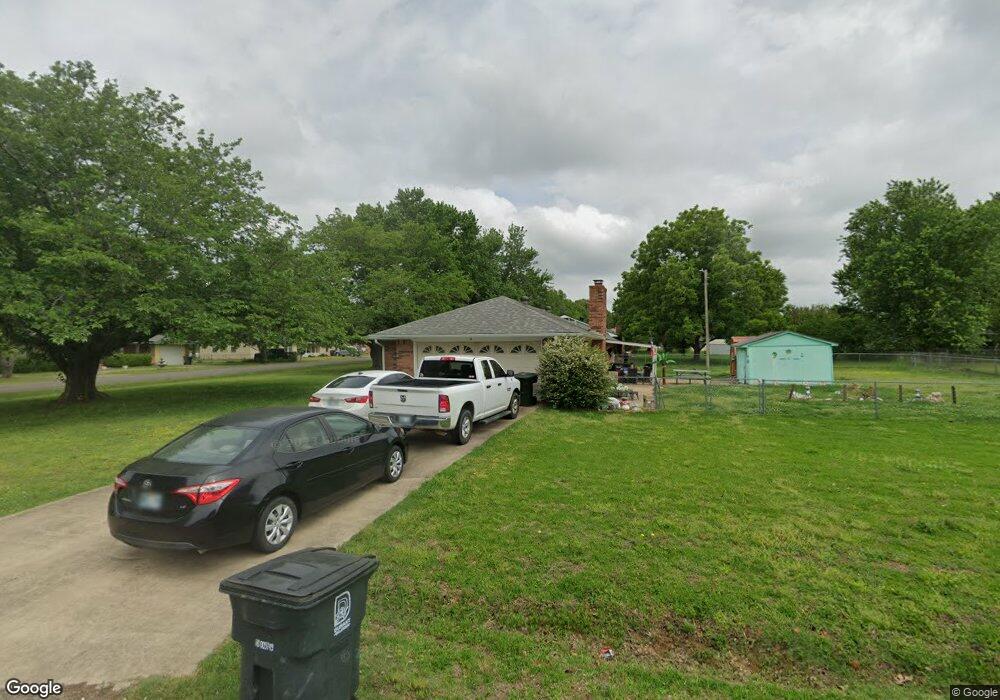
212 Sunnymeadow Dr Durant, OK 74701
Estimated Value: $205,000 - $219,000
4
Beds
2
Baths
1,587
Sq Ft
$134/Sq Ft
Est. Value
About This Home
This home is located at 212 Sunnymeadow Dr, Durant, OK 74701 and is currently estimated at $211,905, approximately $133 per square foot. 212 Sunnymeadow Dr is a home located in Bryan County with nearby schools including Northwest Heights Elementary School, Durant Intermediate Elementary School, and Durant Middle School.
Ownership History
Date
Name
Owned For
Owner Type
Purchase Details
Closed on
Aug 12, 2021
Sold by
Rose Marlene Elizabeth
Bought by
Rose Marlene Elizabeth and Rose Adam Dee
Current Estimated Value
Purchase Details
Closed on
Mar 15, 2017
Sold by
Sanford Lucretia Dianna
Bought by
Rose Marlene
Home Financials for this Owner
Home Financials are based on the most recent Mortgage that was taken out on this home.
Original Mortgage
$124,242
Interest Rate
4.19%
Mortgage Type
New Conventional
Purchase Details
Closed on
Apr 26, 2003
Sold by
Tiffie Charles G
Bought by
Rathbun Johnnie R
Purchase Details
Closed on
Nov 29, 1994
Sold by
Spears Oleta
Bought by
Peled Jacquelyn and Peled Poppy F
Purchase Details
Closed on
Jul 23, 1993
Sold by
Spears Oleta
Bought by
Spears Oleta and Spears Thomas E
Create a Home Valuation Report for This Property
The Home Valuation Report is an in-depth analysis detailing your home's value as well as a comparison with similar homes in the area
Home Values in the Area
Average Home Value in this Area
Purchase History
| Date | Buyer | Sale Price | Title Company |
|---|---|---|---|
| Rose Marlene Elizabeth | -- | None Listed On Document | |
| Rose Marlene | $123,000 | None Available | |
| Rathbun Johnnie R | $100,000 | -- | |
| Peled Jacquelyn | $65,000 | -- | |
| Spears Oleta | -- | -- |
Source: Public Records
Mortgage History
| Date | Status | Borrower | Loan Amount |
|---|---|---|---|
| Previous Owner | Rose Marlene | $124,242 |
Source: Public Records
Tax History Compared to Growth
Tax History
| Year | Tax Paid | Tax Assessment Tax Assessment Total Assessment is a certain percentage of the fair market value that is determined by local assessors to be the total taxable value of land and additions on the property. | Land | Improvement |
|---|---|---|---|---|
| 2025 | $1,442 | $15,551 | $1,716 | $13,835 |
| 2024 | $1,442 | $14,811 | $1,716 | $13,095 |
| 2023 | $1,442 | $14,106 | $1,716 | $12,390 |
| 2022 | $0 | $13,560 | $1,650 | $11,910 |
| 2021 | $0 | $13,560 | $1,650 | $11,910 |
| 2020 | $0 | $13,560 | $1,650 | $11,910 |
| 2019 | $1,229 | $13,560 | $1,716 | $11,844 |
| 2018 | $1,219 | $13,560 | $1,716 | $11,844 |
| 2017 | $0 | $12,614 | $1,320 | $11,294 |
| 2016 | $1,046 | $12,614 | $1,320 | $11,294 |
| 2015 | $1,009 | $12,246 | $1,320 | $10,926 |
| 2014 | $885 | $10,878 | $1,320 | $9,558 |
Source: Public Records
Map
Nearby Homes
- 212 Sandpiper Cir
- 511 Meadowlark Ln
- 3701 Dawna St
- 3609 Dawna St
- 105 Quail Ridge Rd
- 116 Quail Ridge Rd
- 3601 Dana Dr
- 5 Christopher Way
- 6 Prosper St
- 5 Prosper St
- 10 Prosper St
- 7 Prosper St
- 9 Prosper St
- 7 Christopher Way
- 13 Christopher Way
- 8 Prosper St
- 12 Christopher Way
- 15 Christopher Way
- 14 Christopher Way
- 6 Christopher Way
- 212 Sunnymeadow Dr
- 212 Sunny Meadows
- 212 E Sunny Meadows St
- 210 Sunnymeadow Dr
- 302 Sunnymeadow Dr
- 302 Sunny Meadows
- 203 Chaparral Dr
- 208 Sunny Meadows
- 208 Sunnymeadow Dr
- 109 Sandpiper Cir
- 211 Sunny Meadows
- 211 Sunnymeadow Dr
- 107 Sandpiper Cir
- 204 Chaparral Dr
- 205 Chaparral Dr
- 504 Sunnymeadow Dr
- 111 Sandpiper Cir
- 209 Sunnymeadow Dr
- 105 Sandpiper Cir
- 206 Chaparral Dr