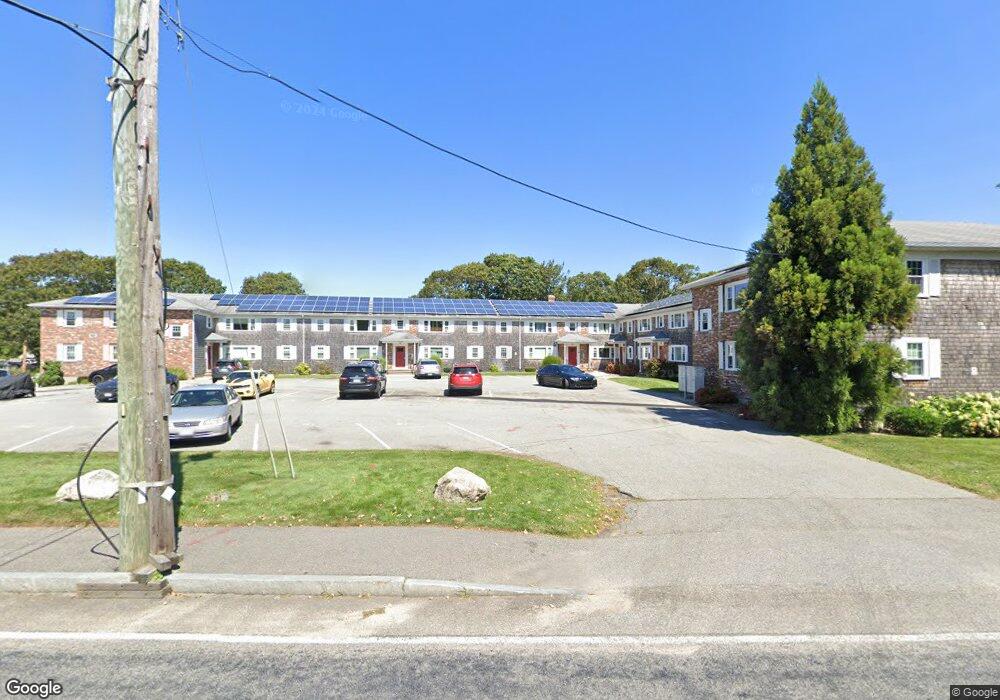
212 Upper County Rd Unit 8B South Dennis, MA 02660
Dennis Port NeighborhoodEstimated Value: $259,000 - $528,000
2
Beds
1
Bath
797
Sq Ft
$416/Sq Ft
Est. Value
About This Home
This home is located at 212 Upper County Rd Unit 8B, South Dennis, MA 02660 and is currently estimated at $331,371, approximately $415 per square foot. 212 Upper County Rd Unit 8B is a home located in Barnstable County with nearby schools including Dennis-Yarmouth Regional High School and St. Pius X. School.
Ownership History
Date
Name
Owned For
Owner Type
Purchase Details
Closed on
Jul 31, 2015
Sold by
Breen Brian F
Bought by
Fratus Robert D
Current Estimated Value
Purchase Details
Closed on
Dec 16, 2011
Sold by
Breen Brian F and Breen A C
Bought by
Fratus Robert D
Purchase Details
Closed on
Oct 29, 2009
Sold by
Witcomb Nancy and Clancy Susan
Bought by
Breen Brian F and Breen Andrea C
Purchase Details
Closed on
Jan 31, 2005
Sold by
Klein Videgar Heather and Videgar Keith M
Bought by
Witcomb Nancy
Purchase Details
Closed on
May 17, 2002
Sold by
Mcguire John F and Mcguire Mary M
Bought by
Videgar Keith M and Videgar Heather
Home Financials for this Owner
Home Financials are based on the most recent Mortgage that was taken out on this home.
Original Mortgage
$62,000
Interest Rate
7.15%
Mortgage Type
Purchase Money Mortgage
Create a Home Valuation Report for This Property
The Home Valuation Report is an in-depth analysis detailing your home's value as well as a comparison with similar homes in the area
Home Values in the Area
Average Home Value in this Area
Purchase History
| Date | Buyer | Sale Price | Title Company |
|---|---|---|---|
| Fratus Robert D | $165,000 | -- | |
| Fratus Robert D | $55,000 | -- | |
| Breen Brian F | $85,000 | -- | |
| Witcomb Nancy | $148,000 | -- | |
| Videgar Keith M | $117,000 | -- |
Source: Public Records
Mortgage History
| Date | Status | Borrower | Loan Amount |
|---|---|---|---|
| Previous Owner | Videgar Keith M | $62,000 |
Source: Public Records
Tax History Compared to Growth
Tax History
| Year | Tax Paid | Tax Assessment Tax Assessment Total Assessment is a certain percentage of the fair market value that is determined by local assessors to be the total taxable value of land and additions on the property. | Land | Improvement |
|---|---|---|---|---|
| 2025 | $848 | $195,900 | $0 | $195,900 |
| 2024 | $823 | $187,400 | $0 | $187,400 |
| 2023 | $725 | $155,300 | $0 | $155,300 |
| 2022 | $702 | $125,300 | $0 | $125,300 |
| 2021 | $706 | $117,100 | $0 | $117,100 |
| 2020 | $694 | $113,700 | $0 | $113,700 |
| 2019 | $445 | $72,200 | $0 | $72,200 |
| 2018 | $437 | $69,000 | $0 | $69,000 |
| 2017 | $424 | $69,000 | $0 | $69,000 |
| 2016 | $430 | $65,900 | $0 | $65,900 |
| 2015 | $422 | $65,900 | $0 | $65,900 |
| 2014 | -- | $65,900 | $0 | $65,900 |
Source: Public Records
Map
Nearby Homes
- 29 Highland St
- 31 Duck Pond Rd
- 3 Jennifer Ln
- 116 Searsville Rd
- 171 Searsville Rd
- 360 Center St
- 401 Main St Unit 201
- 401 Main St Unit 101
- 293 Main St
- 293 Main St
- 20 Aunt Debbys Rd
- 295 Main St
- 95 Center St
- 15 Yenom Rd
- 24 Indian Trail
- 26 Center St
- 3 Pinefield Ln
- 78 Upper County Rd Unit A&B
- 78 Upper County Rd
- 11 Lane Rd
- 212 Upper County Rd Unit 13B
- 212 Upper County Rd Unit 12B
- 212 Upper County Rd Unit 11B
- 212 Upper County Rd Unit 10B
- 212 Upper County Rd Unit 9B
- 212 Upper County Rd Unit 7B
- 212 Upper County Rd Unit 6B
- 212 Upper County Rd Unit 5B
- 212 Upper County Rd Unit 4B
- 212 Upper County Rd Unit 3B
- 212 Upper County Rd Unit 2B
- 212 Upper County Rd Unit 1B
- 212 Upper County Rd Unit 13A
- 212 Upper County Rd Unit 12A
- 212 Upper County Rd Unit 11A
- 212 Upper County Rd Unit 10A
- 212 Upper County Rd Unit 9A
- 212 Upper County Rd Unit 8A
- 212 Upper County Rd Unit 7A
- 212 Upper County Rd Unit 6A