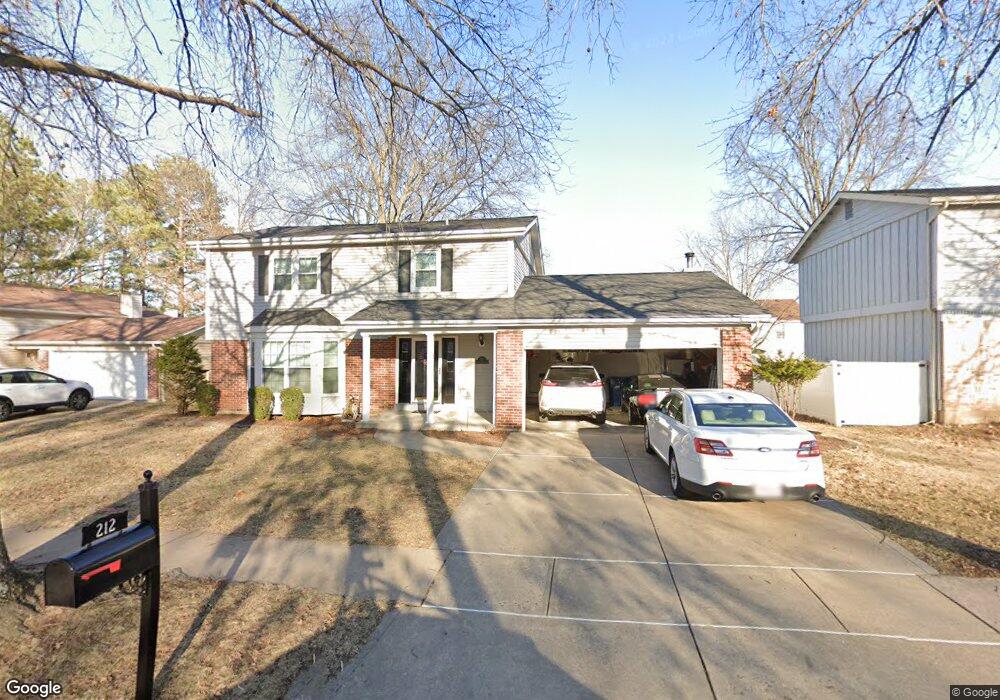
212 Village Creek Ct Ballwin, MO 63021
Estimated Value: $401,800 - $491,000
4
Beds
3
Baths
2,164
Sq Ft
$202/Sq Ft
Est. Value
About This Home
This home is located at 212 Village Creek Ct, Ballwin, MO 63021 and is currently estimated at $437,700, approximately $202 per square foot. 212 Village Creek Ct is a home located in St. Louis County with nearby schools including Ballwin Elementary School, Selvidge Middle School, and Marquette Sr. High School.
Ownership History
Date
Name
Owned For
Owner Type
Purchase Details
Closed on
May 28, 2010
Sold by
Gilliam Thomas J
Bought by
Massaro Christopher and Massaro Kristin
Current Estimated Value
Home Financials for this Owner
Home Financials are based on the most recent Mortgage that was taken out on this home.
Original Mortgage
$233,850
Outstanding Balance
$155,352
Interest Rate
4.87%
Mortgage Type
FHA
Estimated Equity
$282,348
Purchase Details
Closed on
Feb 10, 2010
Sold by
Gilliam Thomas J and Gilliam Laurie A
Bought by
Gilliam Thomas J
Purchase Details
Closed on
Oct 16, 2002
Sold by
Devine Sharon R
Bought by
Gilliam Thomas J and Gilliam Laurie A
Home Financials for this Owner
Home Financials are based on the most recent Mortgage that was taken out on this home.
Original Mortgage
$180,800
Interest Rate
6.13%
Create a Home Valuation Report for This Property
The Home Valuation Report is an in-depth analysis detailing your home's value as well as a comparison with similar homes in the area
Home Values in the Area
Average Home Value in this Area
Purchase History
| Date | Buyer | Sale Price | Title Company |
|---|---|---|---|
| Massaro Christopher | $237,000 | None Available | |
| Gilliam Thomas J | -- | None Available | |
| Gilliam Thomas J | $226,000 | -- |
Source: Public Records
Mortgage History
| Date | Status | Borrower | Loan Amount |
|---|---|---|---|
| Open | Massaro Christopher | $233,850 | |
| Previous Owner | Gilliam Thomas J | $180,800 | |
| Closed | Gilliam Thomas J | $28,180 |
Source: Public Records
Tax History Compared to Growth
Tax History
| Year | Tax Paid | Tax Assessment Tax Assessment Total Assessment is a certain percentage of the fair market value that is determined by local assessors to be the total taxable value of land and additions on the property. | Land | Improvement |
|---|---|---|---|---|
| 2025 | $4,439 | $70,130 | $29,340 | $40,790 |
| 2024 | $4,439 | $63,440 | $19,570 | $43,870 |
| 2023 | $4,436 | $63,440 | $19,570 | $43,870 |
| 2022 | $3,949 | $52,420 | $22,840 | $29,580 |
| 2021 | $3,920 | $52,420 | $22,840 | $29,580 |
| 2020 | $3,751 | $47,800 | $19,570 | $28,230 |
| 2019 | $3,766 | $47,800 | $19,570 | $28,230 |
| 2018 | $3,518 | $42,090 | $9,580 | $32,510 |
| 2017 | $3,435 | $42,090 | $9,580 | $32,510 |
| 2016 | $3,215 | $37,870 | $7,660 | $30,210 |
| 2015 | $3,150 | $37,870 | $7,660 | $30,210 |
| 2014 | $3,257 | $38,190 | $6,420 | $31,770 |
Source: Public Records
Map
Nearby Homes
- 801 Reinke Rd
- 818 Reinke Rd
- 642 Old Ballwin Rd
- 729 Redstart Dr
- 229 Victor Ct
- 681 Twigwood Dr
- 948 Barbara Ann Ln
- 220 Newton Place
- 611 Parker Dr
- 673 Towerwood Dr
- 373 Gateford Dr
- 480 Coachgate Ct
- 1043 Oakwood Farms Ln
- 738 Village Wood Ct
- 410 Gillham Ct
- 587 Twigwood Dr
- 108 Hillsdale Dr
- 811 Wendevy Ct Unit 16D
- 110 Coral Terrace Unit 6
- 128 Shadalane Walk Unit A
- 210 Village Creek Ct
- 216 Village Creek Ct
- 267 Windy Acres Estates Dr
- 271 Windy Acres Estates Dr
- 263 Windy Acres Estates Dr
- 208 Village Creek Ct
- 218 Village Creek Ct
- 211 Village Creek Ct
- 275 Windy Acres Estates Dr
- 215 Village Creek Ct
- 209 Village Creek Ct
- 259 Windy Acres Estates Dr
- 217 Village Creek Ct
- 220 Village Creek Ct
- 206 Village Creek Ct
- 207 Village Creek Ct
- 279 Windy Acres Estates Dr
- 255 Windy Acres Estates Dr
- 219 Village Creek Ct
- 266 Windy Acres Estates Dr