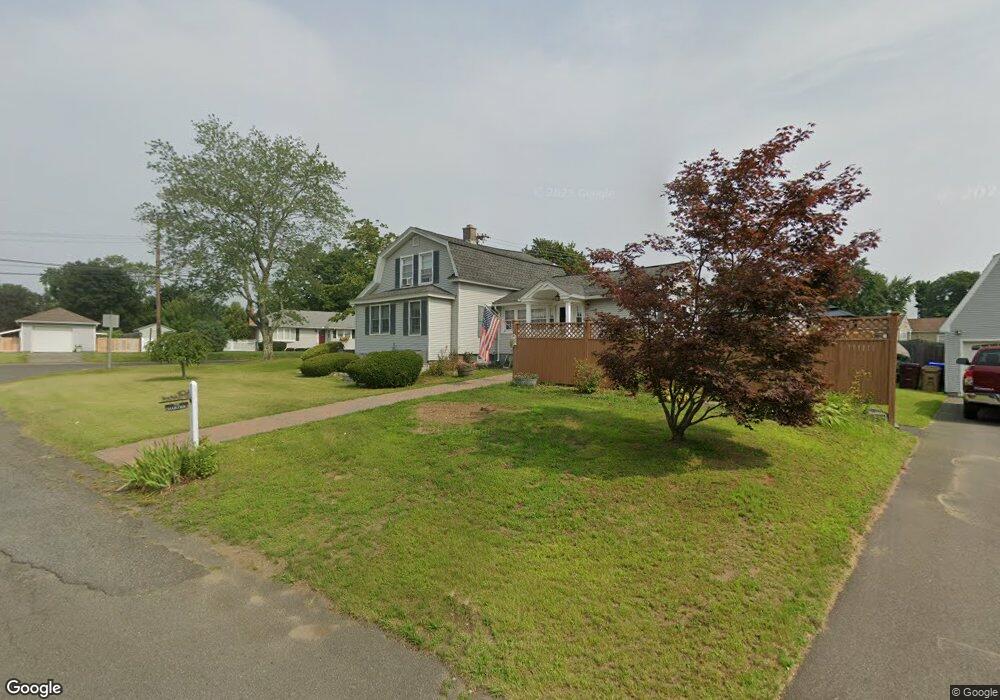
212 West St Ludlow, MA 01056
Estimated Value: $290,000 - $316,000
3
Beds
2
Baths
1,253
Sq Ft
$244/Sq Ft
Est. Value
About This Home
This home is located at 212 West St, Ludlow, MA 01056 and is currently estimated at $306,047, approximately $244 per square foot. 212 West St is a home located in Hampden County with nearby schools including East Street Elementary School, Chapin Street Elementary School, and Paul R. Baird Middle School.
Ownership History
Date
Name
Owned For
Owner Type
Purchase Details
Closed on
Aug 28, 2023
Sold by
Chartier Donald L and Chartier Beverly A
Bought by
Chartier Katherine A
Current Estimated Value
Purchase Details
Closed on
May 1, 1986
Bought by
Chartier Donald L and Chartier Beverly A
Create a Home Valuation Report for This Property
The Home Valuation Report is an in-depth analysis detailing your home's value as well as a comparison with similar homes in the area
Home Values in the Area
Average Home Value in this Area
Purchase History
| Date | Buyer | Sale Price | Title Company |
|---|---|---|---|
| Chartier Katherine A | -- | None Available | |
| Chartier Katherine A | -- | None Available | |
| Chartier Donald L | $57,900 | -- |
Source: Public Records
Mortgage History
| Date | Status | Borrower | Loan Amount |
|---|---|---|---|
| Previous Owner | Chartier Donald L | $45,000 | |
| Previous Owner | Chartier Donald L | $24,000 | |
| Previous Owner | Chartier Donald L | $52,000 | |
| Previous Owner | Chartier Donald L | $4,092 |
Source: Public Records
Tax History Compared to Growth
Tax History
| Year | Tax Paid | Tax Assessment Tax Assessment Total Assessment is a certain percentage of the fair market value that is determined by local assessors to be the total taxable value of land and additions on the property. | Land | Improvement |
|---|---|---|---|---|
| 2025 | $3,702 | $213,400 | $67,500 | $145,900 |
| 2024 | $3,602 | $199,100 | $67,400 | $131,700 |
| 2023 | $3,430 | $175,800 | $59,200 | $116,600 |
| 2022 | $3,302 | $165,200 | $59,200 | $106,000 |
| 2021 | $3,333 | $158,100 | $59,200 | $98,900 |
| 2020 | $3,194 | $154,900 | $58,300 | $96,600 |
| 2019 | $2,983 | $150,500 | $57,700 | $92,800 |
| 2018 | $2,808 | $147,700 | $57,700 | $90,000 |
| 2017 | $2,691 | $145,200 | $56,000 | $89,200 |
| 2016 | $2,558 | $141,100 | $54,900 | $86,200 |
| 2015 | $2,402 | $138,900 | $54,300 | $84,600 |
Source: Public Records
Map
Nearby Homes