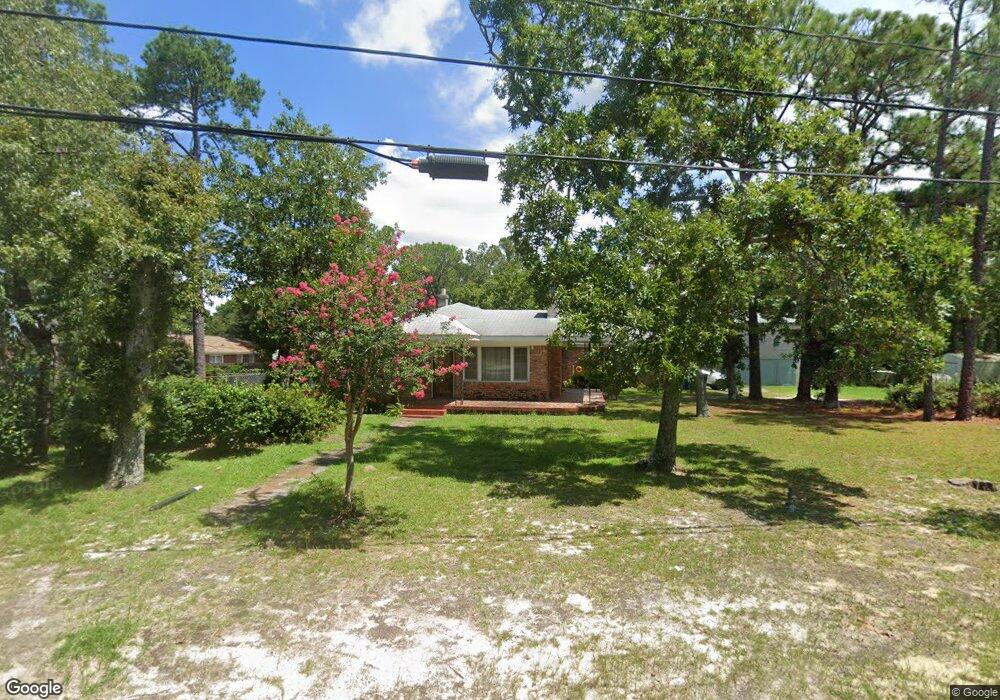
2120 Chaney St Columbia, SC 29204
Estimated Value: $257,000 - $467,633
4
Beds
4
Baths
4,025
Sq Ft
$88/Sq Ft
Est. Value
About This Home
This home is located at 2120 Chaney St, Columbia, SC 29204 and is currently estimated at $353,158, approximately $87 per square foot. 2120 Chaney St is a home located in Richland County with nearby schools including Brockman Elementary School, Satchel Ford Elementary School, and W.G. Sanders Middle School.
Ownership History
Date
Name
Owned For
Owner Type
Purchase Details
Closed on
Nov 19, 2020
Sold by
Simons Avondale B
Bought by
Simons Avondale B and Scott Mildred A
Current Estimated Value
Home Financials for this Owner
Home Financials are based on the most recent Mortgage that was taken out on this home.
Original Mortgage
$276,011
Outstanding Balance
$245,611
Interest Rate
2.8%
Mortgage Type
New Conventional
Estimated Equity
$107,547
Purchase Details
Closed on
Oct 2, 2018
Sold by
Simons Avondale B and Estate Of Dwight Steven Simons
Bought by
Simons Avondale B
Purchase Details
Closed on
Jun 5, 2008
Sold by
Simons Dwight
Bought by
Simons Avondale B
Purchase Details
Closed on
Mar 4, 2008
Sold by
Simons Justice
Bought by
Simons Dwight
Create a Home Valuation Report for This Property
The Home Valuation Report is an in-depth analysis detailing your home's value as well as a comparison with similar homes in the area
Home Values in the Area
Average Home Value in this Area
Purchase History
| Date | Buyer | Sale Price | Title Company |
|---|---|---|---|
| Simons Avondale B | -- | None Available | |
| Simons Avondale B | -- | None Listed On Document | |
| Simons Avondale B | -- | None Available | |
| Simons Avondale B | -- | -- | |
| Simons Dwight | -- | -- |
Source: Public Records
Mortgage History
| Date | Status | Borrower | Loan Amount |
|---|---|---|---|
| Open | Simons Avondale B | $276,011 | |
| Closed | Simons Avondale B | $276,011 |
Source: Public Records
Tax History Compared to Growth
Tax History
| Year | Tax Paid | Tax Assessment Tax Assessment Total Assessment is a certain percentage of the fair market value that is determined by local assessors to be the total taxable value of land and additions on the property. | Land | Improvement |
|---|---|---|---|---|
| 2024 | $1,761 | $255,300 | $0 | $0 |
| 2023 | $1,761 | $8,880 | $0 | $0 |
| 2022 | $1,610 | $222,000 | $4,400 | $217,600 |
| 2021 | $1,663 | $8,880 | $0 | $0 |
| 2020 | $1,754 | $8,880 | $0 | $0 |
| 2019 | $1,766 | $8,880 | $0 | $0 |
| 2018 | $1,752 | $8,610 | $0 | $0 |
| 2017 | $1,706 | $8,610 | $0 | $0 |
| 2016 | $1,645 | $8,610 | $0 | $0 |
| 2015 | $1,645 | $8,610 | $0 | $0 |
| 2014 | $1,644 | $215,200 | $0 | $0 |
| 2013 | -- | $8,610 | $0 | $0 |
Source: Public Records
Map
Nearby Homes
- 3910 Highland Park Dr
- 4000 Maurice St
- 4100 Highland Park Dr
- 0 Oscar St
- 230 Clive St
- 2025 Cushman Dr
- 5748 Farrow Rd
- 1707 Dairy St
- 3801 Baldwin Rd
- 1601 McCaw Rd
- 6209 Farrow Rd
- 308 Wilkes Rd
- 1626 Albritton Rd
- 311 Abraham St
- 401 Abraham St
- 3123 Truman St
- 1204 Carter St
- 3116 Truman St
- 1523 Colleton St
- 119 Easter St
- 2120 Chaney St
- 3914 Highland Park Dr
- 3900 Highland Park Dr
- 3920 Highland Park Dr
- 3927 Oscar St
- 2119 Chaney St
- 3928 Highland Park Dr
- 3835 Roscoe St
- 2111 Chaney St
- 3911 Highland Park Dr
- 3828 Roscoe St
- 3915 Highland Park Dr
- 2103 Chaney St
- 3900 Pine Cone Dr
- 3931 Oscar St
- 3831 Roscoe St
- 3934 Highland Park Dr
- 3817 Pine Cone Dr
- 3921 Highland Park Dr
- 3906 Pine Cone Dr