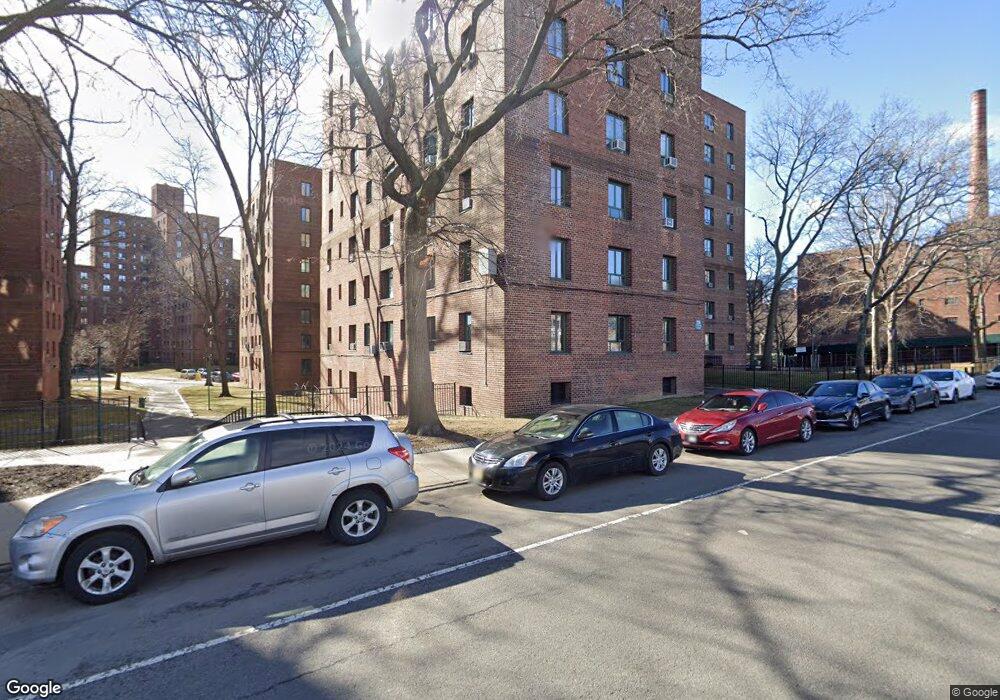
2120 E Tremont Ave Unit 6F Bronx, NY 10462
Parkchester NeighborhoodEstimated Value: $275,862 - $329,000
Studio
--
Bath
790
Sq Ft
$385/Sq Ft
Est. Value
About This Home
This home is located at 2120 E Tremont Ave Unit 6F, Bronx, NY 10462 and is currently estimated at $303,966, approximately $384 per square foot. 2120 E Tremont Ave Unit 6F is a home located in Bronx County with nearby schools including P.S. 106 - Parkchester, M.S. 127 - The Castle Hill Middle School, and Icahn Charter School 2.
Ownership History
Date
Name
Owned For
Owner Type
Purchase Details
Closed on
May 30, 2007
Sold by
Alston-Phillips Leah
Bought by
Chin Sedrick and Pershad Leanna
Current Estimated Value
Home Financials for this Owner
Home Financials are based on the most recent Mortgage that was taken out on this home.
Original Mortgage
$142,500
Interest Rate
6.73%
Mortgage Type
Purchase Money Mortgage
Purchase Details
Closed on
Mar 30, 2005
Sold by
Rios Jennife
Bought by
Alston-Phillips Leah
Home Financials for this Owner
Home Financials are based on the most recent Mortgage that was taken out on this home.
Original Mortgage
$99,500
Interest Rate
5.7%
Mortgage Type
Purchase Money Mortgage
Purchase Details
Closed on
Dec 21, 2000
Sold by
Diaz Maria J and Diaz Maria
Bought by
Rios Jannife
Purchase Details
Closed on
Jan 28, 1997
Sold by
Jacobs Grace
Bought by
Diaz Maria
Create a Home Valuation Report for This Property
The Home Valuation Report is an in-depth analysis detailing your home's value as well as a comparison with similar homes in the area
Home Values in the Area
Average Home Value in this Area
Purchase History
| Date | Buyer | Sale Price | Title Company |
|---|---|---|---|
| Chin Sedrick | $150,000 | -- | |
| Alston-Phillips Leah | $100,000 | -- | |
| Rios Jannife | -- | -- | |
| Diaz Maria | $23,000 | Commonwealth Land Title Ins |
Source: Public Records
Mortgage History
| Date | Status | Borrower | Loan Amount |
|---|---|---|---|
| Previous Owner | Chin Sedrick | $142,500 | |
| Previous Owner | Alston-Phillips Leah | $99,500 |
Source: Public Records
Tax History
| Year | Tax Paid | Tax Assessment Tax Assessment Total Assessment is a certain percentage of the fair market value that is determined by local assessors to be the total taxable value of land and additions on the property. | Land | Improvement |
|---|---|---|---|---|
| 2025 | $1,531 | $32,525 | $9,310 | $23,215 |
| 2024 | $1,531 | $32,356 | $8,991 | $23,365 |
| 2023 | $952 | $31,614 | $8,569 | $23,045 |
| 2022 | $828 | $30,764 | $9,097 | $21,667 |
| 2021 | $1,151 | $29,836 | $8,169 | $21,667 |
| 2020 | $501 | $31,952 | $8,169 | $23,783 |
| 2019 | $383 | $31,434 | $7,651 | $23,783 |
| 2018 | $3,255 | $28,933 | $5,150 | $23,783 |
Source: Public Records
Map
Nearby Homes
- 1595 Metropolitan Ave Unit 7D
- 2120 E Tremont Ave Unit 4F
- 1591 Metropolitan Ave Unit 3I
- 2150 E Tremont Ave Unit 4C
- 2090 E Tremont Ave Unit 10D
- 1604 Metropolitan Ave Unit 12G
- 1604 Metropolitan Ave Unit 8F
- 2220 E Tremont Ave Unit 5G
- 2220 E Tremont Ave Unit 7F
- 1560 Metropolitan Ave Unit ME
- 1735 Purdy St Unit 2B
- 1735 Purdy St Unit 5H
- 1725 Purdy St Unit ME
- 1530 Metropolitan Ave Unit 1E
- 1594 Metropolitan Ave Unit MH
- 1504 Metropolitan Ave Unit ME
- 20 Metropolitan Oval Unit 11A
- 18 Metropolitan Oval Unit 8A
- 18 Metropolitan Oval Unit 3C
- 1503 Metropolitan Ave Unit 4F
- 2120 E Tremont Ave Unit ME
- 2120 E Tremont Ave Unit MD
- 2120 E Tremont Ave Unit MA
- 2120 E Tremont Ave Unit 7H
- 2120 E Tremont Ave Unit 7G
- 2120 E Tremont Ave Unit 7F
- 2120 E Tremont Ave Unit 7E
- 2120 E Tremont Ave Unit 7D
- 2120 E Tremont Ave Unit 7C
- 2120 E Tremont Ave Unit 7B
- 2120 E Tremont Ave Unit 7A
- 2120 E Tremont Ave Unit 6H
- 2120 E Tremont Ave Unit 6G
- 2120 E Tremont Ave Unit 6E
- 2120 E Tremont Ave Unit 6D
- 2120 E Tremont Ave Unit 6C
- 2120 E Tremont Ave Unit 6B
- 2120 E Tremont Ave Unit 6A
- 2120 E Tremont Ave Unit 5H
- 2120 E Tremont Ave Unit 5G
Your Personal Tour Guide
Ask me questions while you tour the home.