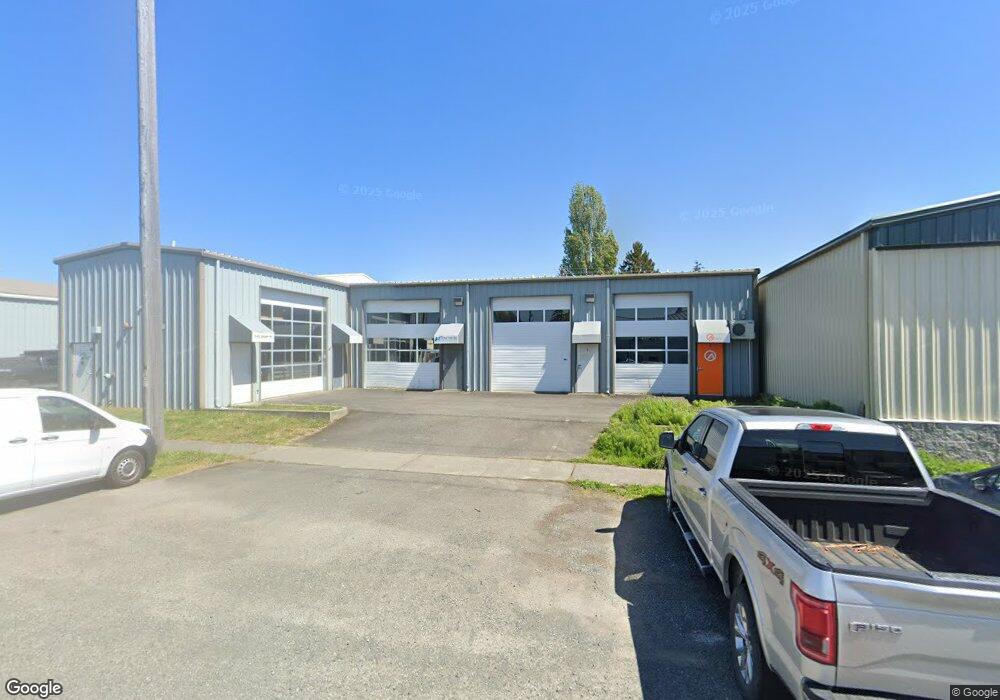
2120 Grant St Unit 3 Bellingham, WA 98225
Sunnyland NeighborhoodEstimated Value: $254,005
--
Bed
--
Bath
717
Sq Ft
$354/Sq Ft
Est. Value
About This Home
This home is located at 2120 Grant St Unit 3, Bellingham, WA 98225 and is currently estimated at $254,005, approximately $354 per square foot. 2120 Grant St Unit 3 is a home located in Whatcom County with nearby schools including Sunnyland Elementary School, Whatcom Middle School, and Bellingham High School.
Ownership History
Date
Name
Owned For
Owner Type
Purchase Details
Closed on
Oct 4, 2011
Sold by
Valum Thor
Bought by
Byrnes Tyler
Current Estimated Value
Create a Home Valuation Report for This Property
The Home Valuation Report is an in-depth analysis detailing your home's value as well as a comparison with similar homes in the area
Home Values in the Area
Average Home Value in this Area
Purchase History
| Date | Buyer | Sale Price | Title Company |
|---|---|---|---|
| Byrnes Tyler | $90,280 | First American Title Ins |
Source: Public Records
Tax History Compared to Growth
Tax History
| Year | Tax Paid | Tax Assessment Tax Assessment Total Assessment is a certain percentage of the fair market value that is determined by local assessors to be the total taxable value of land and additions on the property. | Land | Improvement |
|---|---|---|---|---|
| 2024 | $1,336 | $188,275 | $61,613 | $126,662 |
| 2023 | $1,336 | $171,155 | $56,011 | $115,144 |
| 2022 | $1,235 | $154,193 | $50,460 | $103,733 |
| 2021 | $1,308 | $132,925 | $43,500 | $89,425 |
| 2020 | $1,050 | $132,925 | $43,500 | $89,425 |
| 2019 | $924 | $103,137 | $25,408 | $77,729 |
| 2018 | $1,012 | $90,959 | $22,408 | $68,551 |
| 2017 | $890 | $85,167 | $20,981 | $64,186 |
| 2016 | $855 | $78,317 | $19,294 | $59,023 |
| 2015 | $859 | $78,317 | $19,294 | $59,023 |
| 2014 | -- | $76,110 | $18,750 | $57,360 |
| 2013 | -- | $73,727 | $18,375 | $55,352 |
Source: Public Records
Map
Nearby Homes
- 2120 Grant St Unit 2
- 2120 Grant St Unit 7
- 2120 Grant St
- 2120 Grant St Unit 4
- 2120 Grant St Unit 8
- 2110 Grant St
- 2134 Grant St
- 2119 Humboldt St
- 2115 Humboldt St
- 511 Kentucky St
- 2121 Humboldt St
- 2125 Humboldt St
- 521 Kentucky St
- 2131 Humboldt St
- 409 Kentucky St
- 2112 Humboldt St
- 2116 Franklin St
- 2114 Franklin St
- 2114 Humboldt St
- 2110 Humboldt St