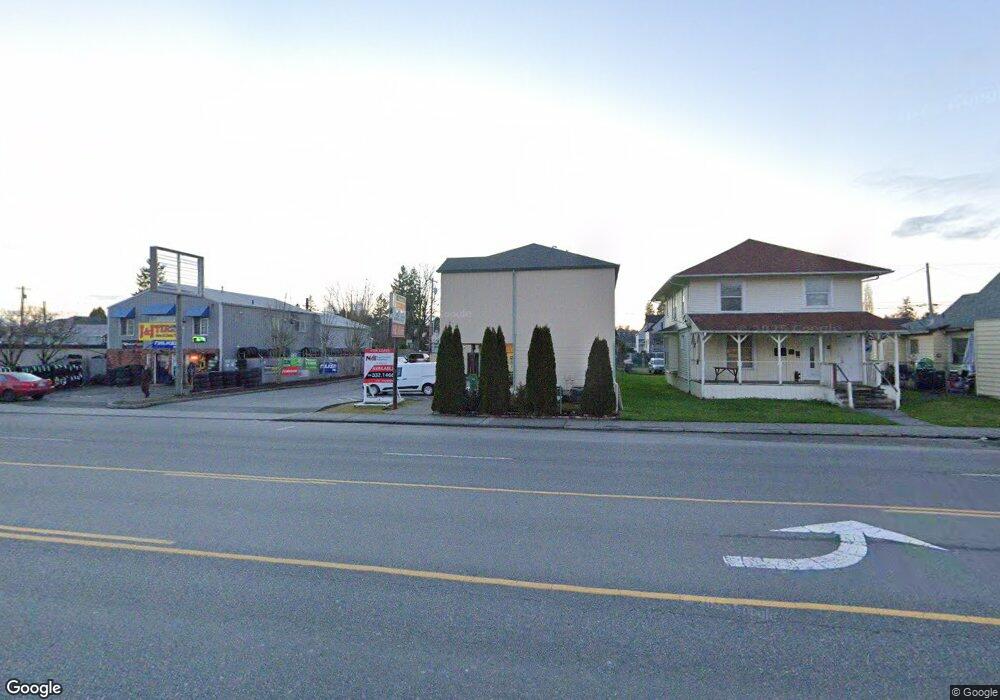
2120 N Broadway Everett, WA 98201
Bayside Neighborhood
2
Beds
1
Bath
1,122
Sq Ft
9,148
Sq Ft Lot
About This Home
This home is located at 2120 N Broadway, Everett, WA 98201. 2120 N Broadway is a home located in Snohomish County with nearby schools including Hawthorne Elementary School, North Middle School, and Everett High School.
Ownership History
Date
Name
Owned For
Owner Type
Purchase Details
Closed on
Aug 10, 2007
Sold by
Tec Holdings 51 Llc
Bought by
Siew Tony and Siew Ngoc Yen
Home Financials for this Owner
Home Financials are based on the most recent Mortgage that was taken out on this home.
Original Mortgage
$305,000
Outstanding Balance
$193,012
Interest Rate
6.65%
Mortgage Type
Commercial
Purchase Details
Closed on
Mar 21, 2007
Sold by
Hendrickson Kevin and Hendrickson Jona
Bought by
Tec Holdings 51 Llc
Home Financials for this Owner
Home Financials are based on the most recent Mortgage that was taken out on this home.
Original Mortgage
$616,500
Interest Rate
6.31%
Mortgage Type
Commercial
Purchase Details
Closed on
Nov 25, 2003
Sold by
Landi Joseph T and Landi Joan Robertson
Bought by
Hendrickson Kevin and Hendrickson Jona
Purchase Details
Closed on
Aug 14, 1996
Sold by
Bavasi Robert J and Bavasi Margaret B
Bought by
Landi Joseph T and Landi Joan Robertson
Home Financials for this Owner
Home Financials are based on the most recent Mortgage that was taken out on this home.
Original Mortgage
$163,629
Interest Rate
8.2%
Create a Home Valuation Report for This Property
The Home Valuation Report is an in-depth analysis detailing your home's value as well as a comparison with similar homes in the area
Home Values in the Area
Average Home Value in this Area
Purchase History
| Date | Buyer | Sale Price | Title Company |
|---|---|---|---|
| Siew Tony | -- | Stewart | |
| Tec Holdings 51 Llc | $640,000 | Stewart | |
| Hendrickson Kevin | $475,000 | Chicago Title Insurance Co | |
| Landi Joseph T | $255,000 | Stewart Title Company |
Source: Public Records
Mortgage History
| Date | Status | Borrower | Loan Amount |
|---|---|---|---|
| Open | Siew Tony | $305,000 | |
| Previous Owner | Tec Holdings 51 Llc | $616,500 | |
| Previous Owner | Landi Joseph T | $163,629 |
Source: Public Records
Tax History
| Year | Tax Paid | Tax Assessment Tax Assessment Total Assessment is a certain percentage of the fair market value that is determined by local assessors to be the total taxable value of land and additions on the property. | Land | Improvement |
|---|---|---|---|---|
| 2025 | $972 | $114,600 | $108,000 | $6,600 |
| 2024 | $972 | $113,200 | $108,000 | $5,200 |
| 2023 | $928 | $113,000 | $108,000 | $5,000 |
| 2022 | $1,035 | $113,000 | $108,000 | $5,000 |
| 2020 | $1,740 | $155,000 | $150,000 | $5,000 |
| 2019 | $1,775 | $159,100 | $150,000 | $9,100 |
| 2018 | $1,947 | $160,000 | $150,000 | $10,000 |
| 2017 | $1,860 | $152,200 | $144,000 | $8,200 |
| 2016 | $1,763 | $151,700 | $144,000 | $7,700 |
Source: Public Records
Map
Nearby Homes
- 2009 Lombard Ave
- 1925 Lombard Ave Unit A
- 1925 Lombard Ave Unit A,B,C
- 2005 Mcdougall Ave
- 1920 Broadway
- 2130 Virginia Ave
- 1612 21st St
- 2405 Rockefeller Ave
- 2221 Virginia Ave
- 2217 Hoyt Ave Unit C
- 2217 Hoyt Ave Unit B
- 2515 Oakes Ave
- 1721 Mcdougall Ave
- 3405 3425 Rucker Ave
- 2108 Grand Ave
- 2707 18th St
- 2302 Grand Ave
- 2432 Pine St Unit A
- 2420 Grand Ave Unit 301
- 1621 Baker Ave
- 2114 Broadway
- 2128 Broadway
- 2110 Broadway
- 2108 Broadway
- 2119 Lombard Ave
- 2117 Lombard Ave
- 2123 Lombard Ave
- 2125 Lombard Ave
- 2102 Broadway
- 2131 Lombard Ave
- 2201 Broadway
- 2107 Lombard Ave
- 2105 Lombard Ave
- 2202 Broadway
- 2101 Lombard Ave
- 2201 Lombard Ave
- 2120 Mcdougall Ave
- 2122 Mcdougall Ave
- 2116 Mcdougall Ave
Your Personal Tour Guide
Ask me questions while you tour the home.