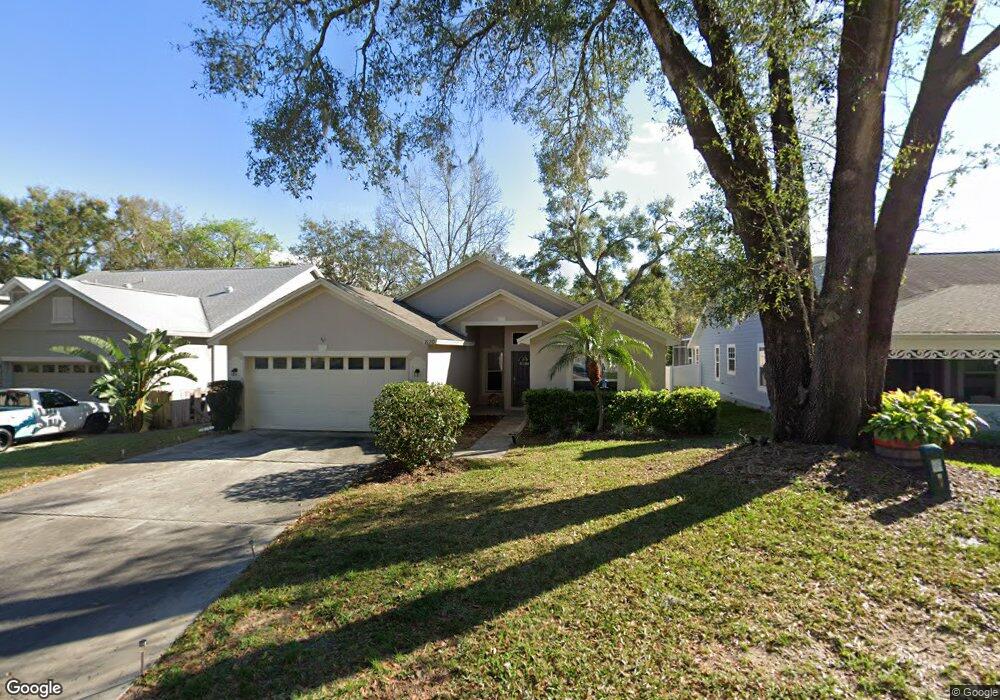
2120 Old South Ln Apopka, FL 32712
Estimated Value: $354,000 - $414,000
3
Beds
2
Baths
1,690
Sq Ft
$223/Sq Ft
Est. Value
About This Home
This home is located at 2120 Old South Ln, Apopka, FL 32712 and is currently estimated at $377,198, approximately $223 per square foot. 2120 Old South Ln is a home located in Orange County with nearby schools including Apopka Elementary School, Wolf Lake Middle School, and Apopka High School.
Ownership History
Date
Name
Owned For
Owner Type
Purchase Details
Closed on
Aug 11, 2022
Sold by
Progress Orlando Llc
Bought by
Progress Residential Borrower 21 Llc
Current Estimated Value
Purchase Details
Closed on
May 10, 2005
Sold by
Kirby Nancy A
Bought by
Kashef Khalid
Home Financials for this Owner
Home Financials are based on the most recent Mortgage that was taken out on this home.
Original Mortgage
$158,400
Interest Rate
5.28%
Mortgage Type
Fannie Mae Freddie Mac
Purchase Details
Closed on
Feb 7, 2003
Sold by
Baugh Audrey and Baugh Gary
Bought by
Kirby Nancy
Home Financials for this Owner
Home Financials are based on the most recent Mortgage that was taken out on this home.
Original Mortgage
$170,300
Interest Rate
5.89%
Mortgage Type
Purchase Money Mortgage
Purchase Details
Closed on
Jun 15, 2001
Sold by
Richard L Mark I
Bought by
Baugh Audrey
Create a Home Valuation Report for This Property
The Home Valuation Report is an in-depth analysis detailing your home's value as well as a comparison with similar homes in the area
Home Values in the Area
Average Home Value in this Area
Purchase History
| Date | Buyer | Sale Price | Title Company |
|---|---|---|---|
| Progress Residential Borrower 21 Llc | $100 | None Listed On Document | |
| Kashef Khalid | $198,000 | Exceptional Title Insurance | |
| Kirby Nancy | $163,300 | First Security Title Of Orla | |
| Baugh Audrey | $17,000 | -- |
Source: Public Records
Mortgage History
| Date | Status | Borrower | Loan Amount |
|---|---|---|---|
| Previous Owner | Kashef Khalid | $158,400 | |
| Previous Owner | Kirby Nancy | $170,300 | |
| Previous Owner | Baugh Audrey | $50,000 |
Source: Public Records
Tax History Compared to Growth
Tax History
| Year | Tax Paid | Tax Assessment Tax Assessment Total Assessment is a certain percentage of the fair market value that is determined by local assessors to be the total taxable value of land and additions on the property. | Land | Improvement |
|---|---|---|---|---|
| 2025 | $5,024 | $317,970 | $90,000 | $227,970 |
| 2024 | $4,600 | $307,310 | $90,000 | $217,310 |
| 2023 | $4,600 | $291,104 | $90,000 | $201,104 |
| 2022 | $3,861 | $259,265 | $90,000 | $169,265 |
| 2021 | $3,433 | $213,637 | $65,000 | $148,637 |
| 2020 | $3,088 | $199,812 | $50,000 | $149,812 |
| 2019 | $2,997 | $190,986 | $40,000 | $150,986 |
| 2018 | $2,673 | $161,450 | $40,000 | $121,450 |
| 2017 | $2,612 | $158,330 | $40,000 | $118,330 |
| 2016 | $2,609 | $154,790 | $40,000 | $114,790 |
| 2015 | $2,470 | $147,153 | $40,000 | $107,153 |
| 2014 | $2,363 | $138,796 | $40,000 | $98,796 |
Source: Public Records
Map
Nearby Homes
- 1034 Old South Ln
- 925 Counts Crest Cir
- 1090 Pebble Beach Ct
- 1920 Abbington St Unit 30-D-2
- 1115 Chebon Ct Unit A
- 2068 Nexus Ct
- 858 Errol Pkwy
- 2062 Lake Marion Dr
- 1432 Park Leah
- 908 Hilly Bend Dr
- 2653 Spangler St
- 1542 Islay Ct
- 1628 Lake Marion Dr
- 618 Via Milano
- 1546 Stormway Ct
- 1034 Villa Ln Unit 18
- 1022 Villa Ln Unit 11
- 1337 Villa Ln Unit 49
- 1339 Villa Ln Unit 50
- 1333 Villa Ln Unit 47
- 2120 Old Ln S
- 2112 Old Ln S
- 2112 Old South Ln
- 2128 Old South Ln
- 2102 Old South Ln
- 949 Woodcraft Dr
- 1026 Sweet Tree Ct
- 943 Woodcraft Dr
- 1053 Cottonwood Ct
- 2048 Old South Ln
- 953 Woodcraft Dr
- 2206 Old Ln S
- 2206 Old South Ln
- 937 Woodcraft Dr
- 1034 Sweet Tree Ct
- 2040 Old Ln S
- 1061 Cottonwood Ct
- 2040 Old South Ln
- 2214 Old South Ln
- 2214 Old Ln S