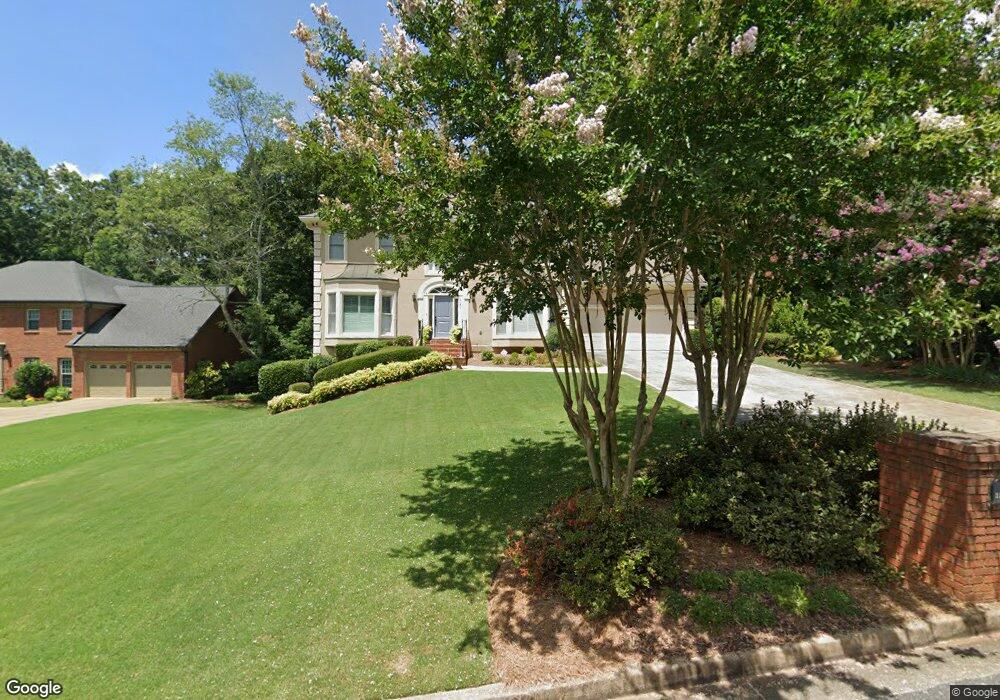
2120 Pearwood Path Roswell, GA 30076
Estimated Value: $722,000 - $836,000
4
Beds
4
Baths
3,147
Sq Ft
$240/Sq Ft
Est. Value
About This Home
This home is located at 2120 Pearwood Path, Roswell, GA 30076 and is currently estimated at $754,127, approximately $239 per square foot. 2120 Pearwood Path is a home located in Fulton County with nearby schools including Hillside Elementary School, Haynes Bridge Middle School, and Centennial High School.
Ownership History
Date
Name
Owned For
Owner Type
Purchase Details
Closed on
Aug 12, 2005
Sold by
Buziak John P and Buziak Christine
Bought by
Wakefield Ronald and Wakefield Gladys
Current Estimated Value
Home Financials for this Owner
Home Financials are based on the most recent Mortgage that was taken out on this home.
Original Mortgage
$301,400
Outstanding Balance
$157,820
Interest Rate
5.61%
Mortgage Type
New Conventional
Estimated Equity
$596,307
Purchase Details
Closed on
Jul 19, 2001
Sold by
Dubrey James and Dubrey Madelyn L
Bought by
Buziak John P and Buziak Christine Y
Home Financials for this Owner
Home Financials are based on the most recent Mortgage that was taken out on this home.
Original Mortgage
$225,000
Interest Rate
7.09%
Purchase Details
Closed on
Dec 29, 1997
Sold by
Cox Joe W and Cox Betty
Bought by
Dubrey James and Dubrey Madelyn
Create a Home Valuation Report for This Property
The Home Valuation Report is an in-depth analysis detailing your home's value as well as a comparison with similar homes in the area
Home Values in the Area
Average Home Value in this Area
Purchase History
| Date | Buyer | Sale Price | Title Company |
|---|---|---|---|
| Wakefield Ronald | $355,500 | -- | |
| Buziak John P | $295,000 | -- | |
| Dubrey James | $247,000 | -- |
Source: Public Records
Mortgage History
| Date | Status | Borrower | Loan Amount |
|---|---|---|---|
| Open | Wakefield Ronald | $301,400 | |
| Previous Owner | Buziak John P | $225,000 | |
| Closed | Dubrey James | -- |
Source: Public Records
Tax History Compared to Growth
Tax History
| Year | Tax Paid | Tax Assessment Tax Assessment Total Assessment is a certain percentage of the fair market value that is determined by local assessors to be the total taxable value of land and additions on the property. | Land | Improvement |
|---|---|---|---|---|
| 2025 | $860 | $240,240 | $44,840 | $195,400 |
| 2023 | $6,813 | $241,360 | $45,560 | $195,800 |
| 2022 | $3,631 | $209,240 | $30,920 | $178,320 |
| 2021 | $4,297 | $179,520 | $27,440 | $152,080 |
| 2020 | $4,365 | $181,400 | $24,240 | $157,160 |
| 2019 | $699 | $180,200 | $33,200 | $147,000 |
| 2018 | $4,079 | $166,280 | $22,760 | $143,520 |
| 2017 | $3,547 | $133,520 | $17,400 | $116,120 |
| 2016 | $3,546 | $133,520 | $17,400 | $116,120 |
| 2015 | $4,289 | $133,520 | $17,400 | $116,120 |
| 2014 | $3,693 | $133,520 | $17,400 | $116,120 |
Source: Public Records
Map
Nearby Homes
- 245 Spring Ridge Trace
- 1250 Atherton Park
- 260 Spring Ridge Dr
- 1020 Summer Oaks Close Unit 4
- 9195 Nesbit Lakes Dr
- 2642 Long Pointe
- 940 Waters Reach Ct
- 590 Ridgemont Dr
- 920 Waters Reach Ct
- 1095 Northpointe Trace
- 970 Laurel Mill Dr
- 2765 Chandon Place
- 620 Lake Forest Ct
- 585 Saint Regis Ln
- 9985 Lake Forest Way
- 680 Barrington Way
- 515 Forest Place
- 2110 Pearwood Path Unit V
- 2130 Pearwood Path
- 300 Spring Ridge Trace Unit 4B
- 290 Spring Ridge Trace Unit 4B
- 2100 Pearwood Path
- 310 Spring Ridge Trace
- 2105 Pearwood Path
- 2085 Pearwood Path Unit V
- 2140 Pearwood Path
- 280 Spring Ridge Trace
- 2125 Pearwood Path
- 280 Spring Ridge Dr
- 2150 Pearwood Path
- 2145 Pearwood Path
- 320 Spring Ridge Trace
- 2090 Pearwood Path
- 270 Spring Ridge Trace Unit 4B
- 630 Wood Work Way
- 8990 Nesbit Lakes Dr Unit 6
- 620 Wood Work Way