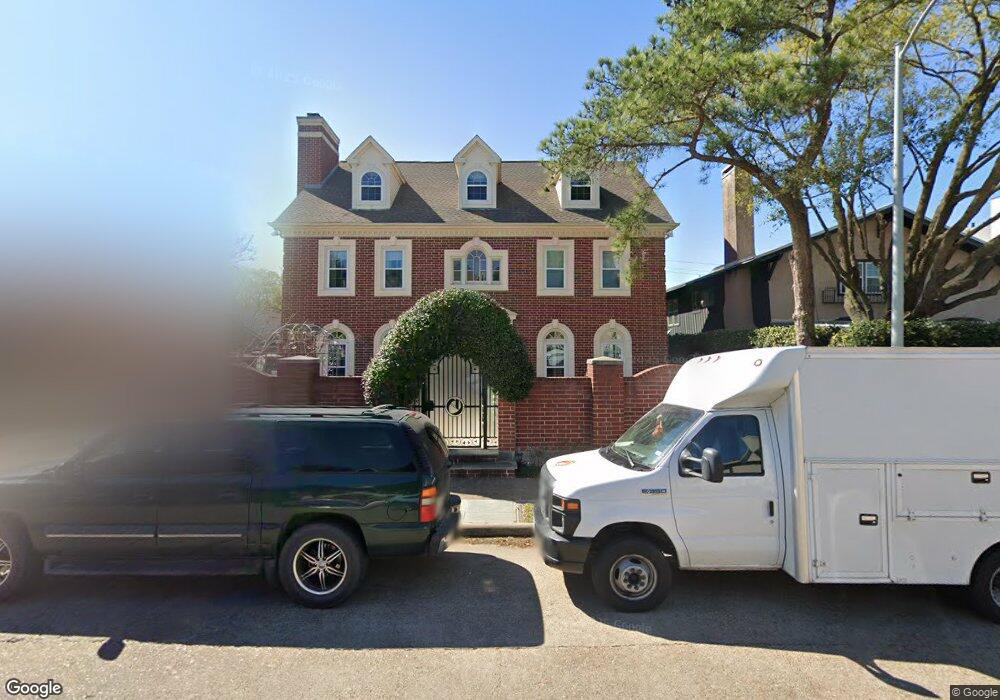
2120 Potomac Dr Unit B Houston, TX 77057
Uptown-Galleria District NeighborhoodEstimated Value: $816,276 - $1,087,000
4
Beds
4
Baths
3,902
Sq Ft
$234/Sq Ft
Est. Value
About This Home
This home is located at 2120 Potomac Dr Unit B, Houston, TX 77057 and is currently estimated at $911,819, approximately $233 per square foot. 2120 Potomac Dr Unit B is a home located in Harris County with nearby schools including Briargrove Elementary School, Tanglewood Middle, and Wisdom High School.
Ownership History
Date
Name
Owned For
Owner Type
Purchase Details
Closed on
Mar 9, 2016
Sold by
Iliffe Property Investments Llc
Bought by
Iliffe Keith
Current Estimated Value
Home Financials for this Owner
Home Financials are based on the most recent Mortgage that was taken out on this home.
Original Mortgage
$450,000
Outstanding Balance
$357,821
Interest Rate
3.79%
Mortgage Type
Purchase Money Mortgage
Estimated Equity
$553,998
Purchase Details
Closed on
Nov 12, 2012
Sold by
Khalil Derrick Lynn S and Khalil Raufat
Bought by
Hiffe Property Investments Llc
Purchase Details
Closed on
Dec 3, 1999
Sold by
Afshari Ali and Afshari Hengameh Taghizadeh
Bought by
Derrick Lynn S
Purchase Details
Closed on
Sep 6, 1994
Sold by
Taghizadeh Ahmed
Bought by
Donnelly George J and Donnelly Maria Lorena
Home Financials for this Owner
Home Financials are based on the most recent Mortgage that was taken out on this home.
Original Mortgage
$75,000
Interest Rate
8.52%
Create a Home Valuation Report for This Property
The Home Valuation Report is an in-depth analysis detailing your home's value as well as a comparison with similar homes in the area
Home Values in the Area
Average Home Value in this Area
Purchase History
| Date | Buyer | Sale Price | Title Company |
|---|---|---|---|
| Iliffe Keith | -- | None Available | |
| Hiffe Property Investments Llc | -- | None Available | |
| Derrick Lynn S | -- | American Title Co | |
| Donnelly George J | -- | -- |
Source: Public Records
Mortgage History
| Date | Status | Borrower | Loan Amount |
|---|---|---|---|
| Open | Iliffe Keith | $450,000 | |
| Previous Owner | Donnelly George J | $75,000 |
Source: Public Records
Tax History Compared to Growth
Tax History
| Year | Tax Paid | Tax Assessment Tax Assessment Total Assessment is a certain percentage of the fair market value that is determined by local assessors to be the total taxable value of land and additions on the property. | Land | Improvement |
|---|---|---|---|---|
| 2025 | $8,434 | $988,445 | $153,881 | $834,564 |
| 2024 | $8,434 | $786,700 | $153,881 | $632,819 |
| 2023 | $8,434 | $831,905 | $153,881 | $678,024 |
| 2022 | $17,437 | $791,909 | $153,881 | $638,028 |
| 2021 | $18,558 | $796,238 | $153,881 | $642,357 |
| 2020 | $19,499 | $805,232 | $153,881 | $651,351 |
| 2019 | $19,190 | $758,350 | $153,881 | $604,469 |
| 2018 | $15,126 | $758,350 | $153,881 | $604,469 |
| 2017 | $19,175 | $758,350 | $153,881 | $604,469 |
| 2016 | $18,019 | $712,620 | $153,881 | $558,739 |
| 2015 | $16,955 | $761,338 | $153,881 | $607,457 |
| 2014 | $16,955 | $659,543 | $153,881 | $505,662 |
Source: Public Records
Map
Nearby Homes
- 2113 Potomac Dr Unit D
- 6005 Inwood Dr Unit A
- 6008 Inwood Dr
- 1919 Potomac Dr
- 1923 Potomac Dr
- 2218 Nantucket Dr
- 2117 Nantucket Dr
- 2009 Nantucket Dr
- 2222 Nantucket Dr Unit B
- 2309 Potomac Dr
- 1815 Potomac Dr Unit C
- 6024 Burgoyne Rd
- 5863 Inwood Dr Unit 5
- 5861 Inwood Dr Unit 9
- 2101 Fountain View Dr Unit 80
- 2101 Fountain View Dr Unit 55
- 2101 Fountain View Dr Unit 76B
- 2101 Fountain View Dr Unit 1
- 2403 Potomac Dr
- 2201 Fountain View Dr Unit 63
- 2120 Potomac Dr
- 2120 Potomac Dr
- 2120 Potomac Dr
- 2120 Potomac Dr Unit A
- 0/402 Prestwick Ct
- 2126 Potomac Dr
- 2116 Potomac Dr
- 2116 Potomac Dr
- 2116 Potomac Dr
- 2116 Potomac Dr Unit A
- 2203 Briarmead Dr
- 2114C Potomac Dr
- 2114A Potomac Dr
- 2114B Potomac Dr
- 2114 Potomac Dr
- 2114 Potomac Dr Unit A
- 2114 Potomac Dr Unit D
- 2114 Potomac Dr Unit B
- 2114 Potomac Dr Unit C
- 2207 Briarmead Dr