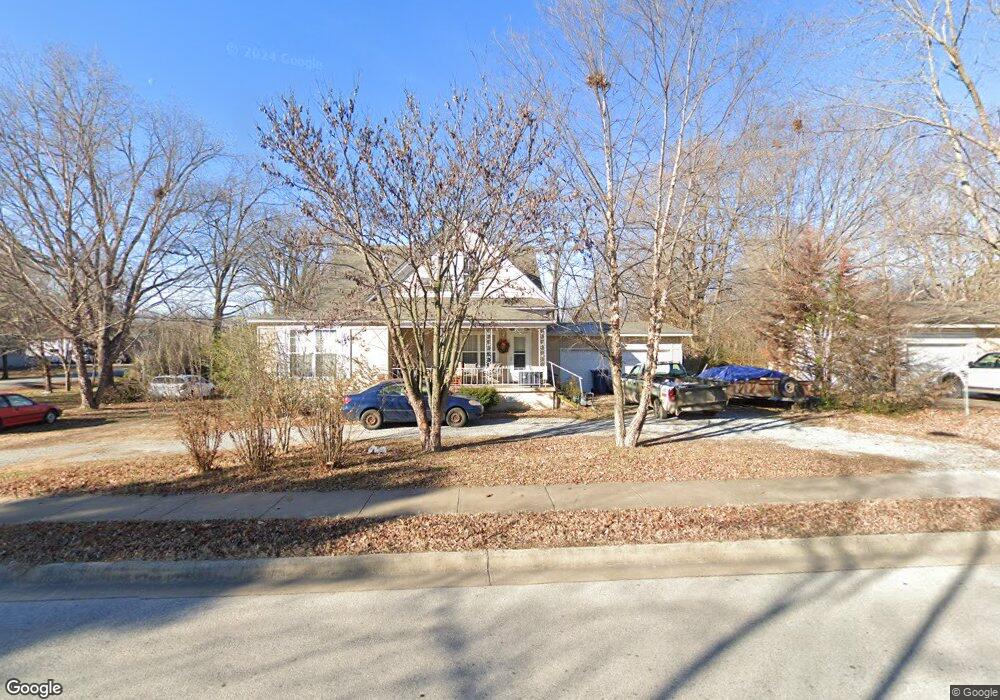
2120 S Mount Olive St Siloam Springs, AR 72761
Estimated Value: $274,000 - $342,000
5
Beds
3
Baths
2,839
Sq Ft
$112/Sq Ft
Est. Value
About This Home
This home is located at 2120 S Mount Olive St, Siloam Springs, AR 72761 and is currently estimated at $318,790, approximately $112 per square foot. 2120 S Mount Olive St is a home located in Benton County with nearby schools including Northside Elementary School, Southside Elementary School, and Delbert Pete & Pat Allen Elementary School.
Ownership History
Date
Name
Owned For
Owner Type
Purchase Details
Closed on
Jul 21, 2025
Sold by
Commissioner Of State Lands
Bought by
Jan Phyllis and Johnson Aubert E
Current Estimated Value
Purchase Details
Closed on
Feb 28, 2022
Sold by
Jan Johnson Phyllis and Jan Aubert E
Bought by
Johnson Phyllis Jan and Johnson Aubert E
Purchase Details
Closed on
Feb 8, 2022
Sold by
Jean Fultner Ima
Bought by
Johnson Phyllis Jan
Purchase Details
Closed on
Mar 10, 2015
Sold by
Mohline Richard J and Jane Mohline L
Bought by
Fultner Ima Jean
Purchase Details
Closed on
Mar 10, 2003
Bought by
Mohline
Purchase Details
Closed on
Sep 4, 2002
Bought by
Merrill Lynch
Purchase Details
Closed on
Nov 15, 2000
Bought by
City Of Siloam 5'
Purchase Details
Closed on
Jun 12, 2000
Bought by
Hardy
Purchase Details
Closed on
Sep 10, 1987
Bought by
Abbott
Purchase Details
Closed on
Aug 27, 1987
Bought by
Eubanks
Create a Home Valuation Report for This Property
The Home Valuation Report is an in-depth analysis detailing your home's value as well as a comparison with similar homes in the area
Home Values in the Area
Average Home Value in this Area
Purchase History
| Date | Buyer | Sale Price | Title Company |
|---|---|---|---|
| Jan Phyllis | $7,718 | None Listed On Document | |
| Johnson Phyllis Jan | -- | Williams Law Firm | |
| Johnson Phyllis Jan | -- | Williams Jay B | |
| Fultner Ima Jean | $99,900 | Realty Title & Closing Svcs | |
| Mohline | $52,000 | -- | |
| Merrill Lynch | -- | -- | |
| City Of Siloam 5' | -- | -- | |
| Hardy | $60,000 | -- | |
| Abbott | $30,000 | -- | |
| Eubanks | $19,000 | -- |
Source: Public Records
Tax History Compared to Growth
Tax History
| Year | Tax Paid | Tax Assessment Tax Assessment Total Assessment is a certain percentage of the fair market value that is determined by local assessors to be the total taxable value of land and additions on the property. | Land | Improvement |
|---|---|---|---|---|
| 2025 | $1,783 | $49,142 | $8,400 | $40,742 |
| 2024 | $1,830 | $49,142 | $8,400 | $40,742 |
| 2023 | $1,830 | $38,650 | $14,400 | $24,250 |
| 2022 | $1,676 | $38,650 | $14,400 | $24,250 |
| 2021 | $1,145 | $38,650 | $14,400 | $24,250 |
| 2020 | $1,150 | $26,470 | $4,800 | $21,670 |
| 2019 | $1,150 | $26,470 | $4,800 | $21,670 |
| 2018 | $1,175 | $26,470 | $4,800 | $21,670 |
| 2017 | $1,175 | $26,470 | $4,800 | $21,670 |
| 2016 | $1,175 | $26,470 | $4,800 | $21,670 |
| 2015 | $1,001 | $17,370 | $2,120 | $15,250 |
| 2014 | $1,001 | $17,370 | $2,120 | $15,250 |
Source: Public Records
Map
Nearby Homes
- 214 Lake Francis Dr
- 110 Cordes Dr
- 0 S Mount Olive St
- 419 W Hannibal St
- 2711 Summitt Dr
- 2503 Chanel St
- 820 W Deer Lodge Ct
- 412 W Kenwood St
- 2786 S Olive Ct
- 2210 E Fennec St
- 0 S Carl St
- 817 S Katlyn Dr
- 0 Tbd Hwy 412 W
- 716 S Washington St
- TBD W 412 Hwy
- 1208 Jo Lynn St
- 622 S Wright St
- 0000 Elm St S
- 1218 E Kenwood St
- 620 S Elm St
- 2102 S Mount Olive St
- 2090 S Mount Olive St
- 2090 S Mt Olive St
- 102 W Highland St
- 2127 S Mount Olive St
- 2185 S Mount Olive St
- 114 W Highland St
- 2217 S Mount Olive St
- 203 W Highland St
- 2.10AC Mt Olive St
- 103 Magnolia St
- 109 Lake Francis Dr
- 124 W Highland St
- 209 W Highland St
- 109 Magnolia St
- 2050 S Mt Olive St
- 2050 S Mount Olive St
- 115 Magnolia St
- 2051 S Mount Olive St
- 115 Magnolia Rd