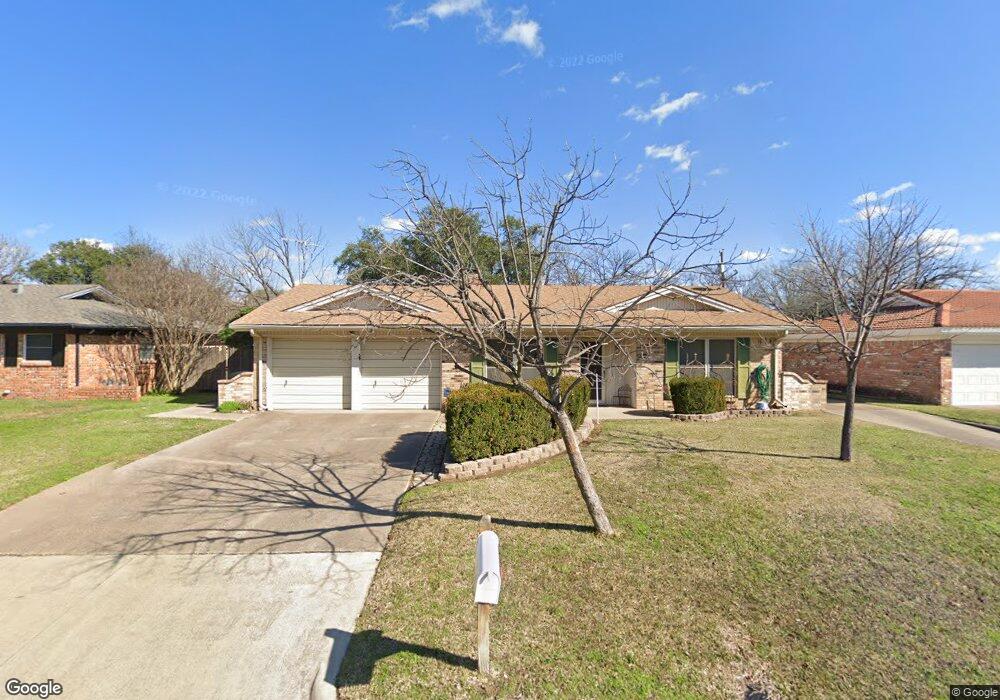
2120 Shady Brook Dr Bedford, TX 76021
Estimated Value: $341,000 - $370,000
4
Beds
2
Baths
1,639
Sq Ft
$216/Sq Ft
Est. Value
About This Home
This home is located at 2120 Shady Brook Dr, Bedford, TX 76021 and is currently estimated at $354,492, approximately $216 per square foot. 2120 Shady Brook Dr is a home located in Tarrant County with nearby schools including Shady Brook Elementary School, Bedford Junior High School, and L.D. Bell High School.
Ownership History
Date
Name
Owned For
Owner Type
Purchase Details
Closed on
Jan 28, 2000
Sold by
Bailey Rodney B and Bailey Tonja L
Bought by
Young Ronald K and Young Mary F
Current Estimated Value
Home Financials for this Owner
Home Financials are based on the most recent Mortgage that was taken out on this home.
Original Mortgage
$96,000
Outstanding Balance
$30,257
Interest Rate
7.95%
Mortgage Type
VA
Estimated Equity
$324,235
Purchase Details
Closed on
Jul 7, 1994
Sold by
Hollis Bobby G and Hollis Barbara Z
Bought by
Bailey Rodney B and Bailey Tonja L
Home Financials for this Owner
Home Financials are based on the most recent Mortgage that was taken out on this home.
Original Mortgage
$67,400
Interest Rate
8.52%
Create a Home Valuation Report for This Property
The Home Valuation Report is an in-depth analysis detailing your home's value as well as a comparison with similar homes in the area
Home Values in the Area
Average Home Value in this Area
Purchase History
| Date | Buyer | Sale Price | Title Company |
|---|---|---|---|
| Young Ronald K | -- | -- | |
| Bailey Rodney B | -- | American Title Company |
Source: Public Records
Mortgage History
| Date | Status | Borrower | Loan Amount |
|---|---|---|---|
| Open | Young Ronald K | $96,000 | |
| Previous Owner | Bailey Rodney B | $67,400 |
Source: Public Records
Tax History Compared to Growth
Tax History
| Year | Tax Paid | Tax Assessment Tax Assessment Total Assessment is a certain percentage of the fair market value that is determined by local assessors to be the total taxable value of land and additions on the property. | Land | Improvement |
|---|---|---|---|---|
| 2025 | $1,167 | $372,865 | $65,000 | $307,865 |
| 2024 | $1,167 | $372,865 | $65,000 | $307,865 |
| 2023 | $6,249 | $352,606 | $40,000 | $312,606 |
| 2022 | $6,469 | $317,608 | $40,000 | $277,608 |
| 2021 | $6,343 | $306,418 | $40,000 | $266,418 |
| 2020 | $5,820 | $251,426 | $40,000 | $211,426 |
| 2019 | $5,406 | $225,205 | $40,000 | $185,205 |
| 2018 | $2,165 | $202,312 | $40,000 | $162,312 |
| 2017 | $4,449 | $192,859 | $25,000 | $167,859 |
| 2016 | $4,045 | $175,807 | $25,000 | $150,807 |
| 2015 | $2,190 | $152,000 | $17,000 | $135,000 |
| 2014 | $2,190 | $152,000 | $17,000 | $135,000 |
Source: Public Records
Map
Nearby Homes
- 2116 Tamworth Ct
- 2225 Shady Brook Dr
- 18 Park Ln
- 6 Park Ln
- 49 Morrow Dr
- 2317 Shady Grove Dr
- 2420 Stonegate Dr N
- 31 Morrow Dr
- 345 Somerset Cir
- 258 Somerset Terrace
- 2501 Shady Grove Dr
- 140 Stonegate Ct
- 93 Regents Park
- 2436 Brookgreen Ct
- 2508 Lakeview Dr
- 2503 Shady Ridge Dr
- 1740 Brown Trail
- 817 Shady Lake Dr
- 2524 Shady Ridge Dr
- 1601 Warwickshire Ct W
- 2124 Shady Brook Dr
- 2116 Shady Brook Dr
- 2125 Shady Grove Dr
- 2129 Shady Grove Dr
- 2128 Shady Brook Dr
- 2112 Shady Brook Dr
- 2121 Shady Grove Dr
- 2133 Shady Grove Dr
- 2121 Shady Brook Dr
- 2125 Shady Brook Dr
- 2137 Shady Grove Dr
- 2117 Shady Grove Dr
- 2132 Shady Brook Dr
- 2108 Shady Brook Dr
- 1105 Shady Brook Ct
- 2109 Shady Brook Dr
- 2133 Shady Brook Dr
- 2128 Shady Grove Dr
- 2141 Shady Grove Dr
- 2113 Shady Grove Dr