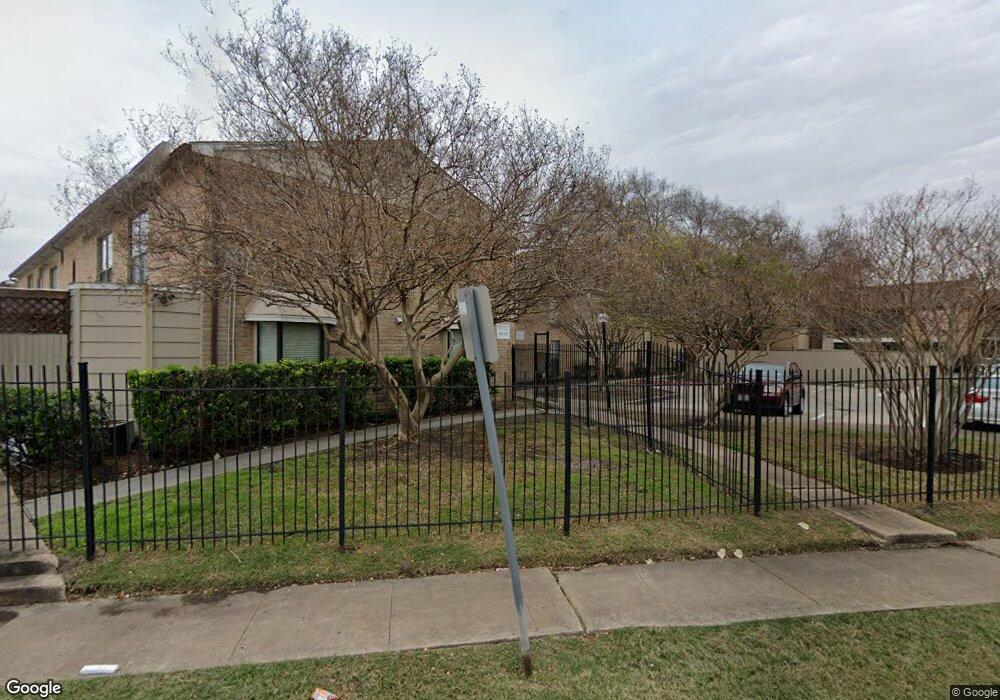
2120 Wilcrest Dr Unit 118 Houston, TX 77042
Briar Forest NeighborhoodEstimated Value: $95,000 - $112,000
2
Beds
2
Baths
700
Sq Ft
$144/Sq Ft
Est. Value
About This Home
This home is located at 2120 Wilcrest Dr Unit 118, Houston, TX 77042 and is currently estimated at $100,691, approximately $143 per square foot. 2120 Wilcrest Dr Unit 118 is a home located in Harris County with nearby schools including Askew Elementary School, Paul Revere Middle School, and Westside High School.
Ownership History
Date
Name
Owned For
Owner Type
Purchase Details
Closed on
Jan 25, 2012
Sold by
Edgewood Park Inc
Bought by
Cross Del Ray and Cross Hyun S
Current Estimated Value
Purchase Details
Closed on
Sep 29, 2010
Sold by
Elbar Investments Inc
Bought by
Edgewood Park Inc
Purchase Details
Closed on
Sep 17, 2010
Sold by
Johnston Timothy
Bought by
Elbar Investments Inc
Purchase Details
Closed on
Dec 12, 2007
Sold by
Williams Vicki J and The Estate Of Sarah B Johnston
Bought by
Johnston Timothy G
Purchase Details
Closed on
Feb 27, 2001
Sold by
Nicholson David Lee
Bought by
Arenstrup Wendy M
Home Financials for this Owner
Home Financials are based on the most recent Mortgage that was taken out on this home.
Original Mortgage
$35,200
Interest Rate
6.97%
Create a Home Valuation Report for This Property
The Home Valuation Report is an in-depth analysis detailing your home's value as well as a comparison with similar homes in the area
Home Values in the Area
Average Home Value in this Area
Purchase History
| Date | Buyer | Sale Price | Title Company |
|---|---|---|---|
| Cross Del Ray | -- | Fidelity National Title | |
| Edgewood Park Inc | -- | Fidelity National Title | |
| Edgewood Park Inc | -- | None Available | |
| Elbar Investments Inc | -- | None Available | |
| Johnston Timothy G | -- | None Available | |
| Arenstrup Wendy M | -- | Stewart Title |
Source: Public Records
Mortgage History
| Date | Status | Borrower | Loan Amount |
|---|---|---|---|
| Previous Owner | Arenstrup Wendy M | $35,200 |
Source: Public Records
Tax History Compared to Growth
Tax History
| Year | Tax Paid | Tax Assessment Tax Assessment Total Assessment is a certain percentage of the fair market value that is determined by local assessors to be the total taxable value of land and additions on the property. | Land | Improvement |
|---|---|---|---|---|
| 2025 | $1,993 | $96,676 | $18,368 | $78,308 |
| 2024 | $1,993 | $95,230 | $18,094 | $77,136 |
| 2023 | $1,993 | $96,901 | $18,411 | $78,490 |
| 2022 | $1,920 | $87,179 | $16,564 | $70,615 |
| 2021 | $1,520 | $65,229 | $12,394 | $52,835 |
| 2020 | $1,718 | $70,927 | $13,476 | $57,451 |
| 2019 | $1,733 | $68,503 | $13,016 | $55,487 |
| 2018 | $1,471 | $56,933 | $10,817 | $46,116 |
| 2017 | $1,339 | $52,973 | $10,065 | $42,908 |
| 2016 | $1,272 | $50,309 | $9,559 | $40,750 |
| 2015 | $947 | $47,016 | $8,933 | $38,083 |
| 2014 | $947 | $36,834 | $6,998 | $29,836 |
Source: Public Records
Map
Nearby Homes
- 11107 Olympia Dr
- 11109 Olympia Dr
- 11119 Olympia Dr
- 11123 Olympia Dr
- 11121 Olympia Dr
- 11129 Olympia Dr
- 2120 Wilcrest Dr Unit 229
- 2120 Wilcrest Dr Unit 107
- 2110 Wilcrest Dr Unit 239
- 2110 Wilcrest Dr Unit 126
- 2110 Wilcrest Dr Unit 138
- 2110 Wilcrest Dr Unit 111
- 2110 Wilcrest Dr Unit 101
- 2110 Wilcrest Dr Unit 112
- 2110 Wilcrest Dr Unit 140
- 2110 Wilcrest Dr Unit 235
- 2110 Wilcrest Dr Unit 123
- 10935 Piping Rock Ln
- 2100 Wilcrest Dr Unit 123
- 2100 Wilcrest Dr Unit 130
- 2120 Wilcrest Dr Unit 110
- 2120 Wilcrest Dr Unit 132
- 2120 Wilcrest Dr Unit 115
- 2120 Wilcrest Dr Unit 232
- 2120 Wilcrest Dr Unit 218
- 2120 Wilcrest Dr Unit 117
- 2120 Wilcrest Dr Unit 133
- 2120 Wilcrest Dr Unit 104
- 2120 Wilcrest Dr Unit 103
- 2120 Wilcrest Dr Unit 102
- 2120 Wilcrest Dr Unit 101
- 2120 Wilcrest Dr Unit 109
- 2120 Wilcrest Dr Unit 108
- 2120 Wilcrest Dr Unit 105
- 2120 Wilcrest Dr Unit 112
- 2120 Wilcrest Dr Unit 111
- 2120 Wilcrest Dr Unit 114
- 2120 Wilcrest Dr Unit 221
- 2120 Wilcrest Dr Unit 220
- 2120 Wilcrest Dr Unit 219