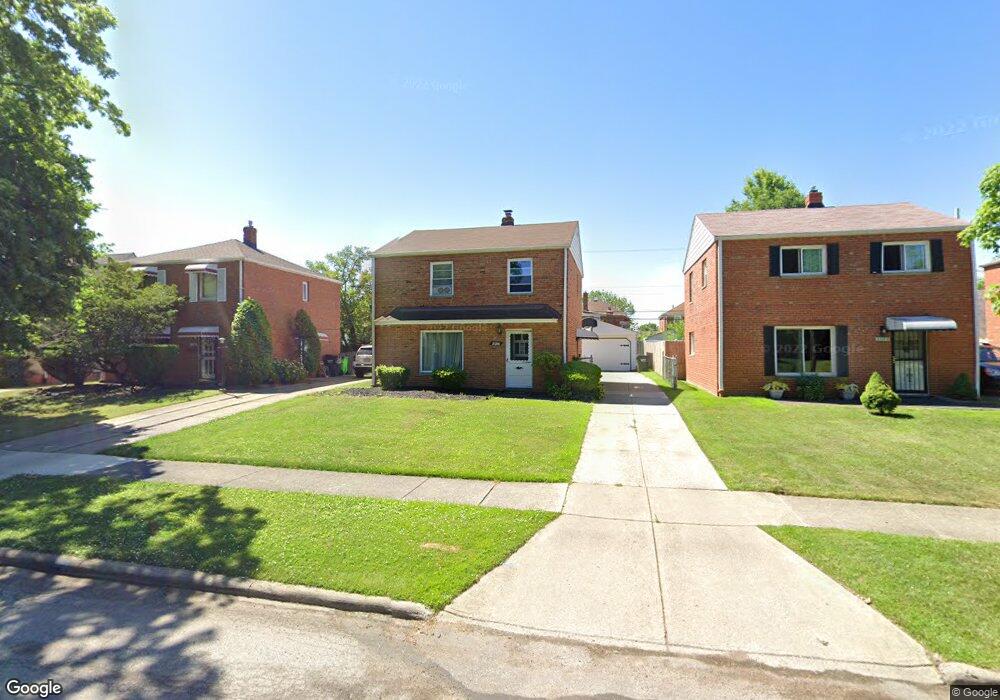
21200 Morris Ave Euclid, OH 44123
Estimated Value: $111,000 - $167,000
3
Beds
1
Bath
1,200
Sq Ft
$108/Sq Ft
Est. Value
About This Home
This home is located at 21200 Morris Ave, Euclid, OH 44123 and is currently estimated at $129,212, approximately $107 per square foot. 21200 Morris Ave is a home located in Cuyahoga County with nearby schools including Arbor Elementary School, Euclid Middle School, and Euclid High School.
Ownership History
Date
Name
Owned For
Owner Type
Purchase Details
Closed on
Jul 24, 2002
Sold by
Anderson Leroy and Anderson Toni M
Bought by
Anderson Leroy
Current Estimated Value
Purchase Details
Closed on
Apr 5, 1999
Sold by
Anderson Leroy
Bought by
Anderson Leroy and Anderson Toni M
Purchase Details
Closed on
May 30, 1997
Sold by
Trinko Gerald F
Bought by
Anderson Leroy
Home Financials for this Owner
Home Financials are based on the most recent Mortgage that was taken out on this home.
Original Mortgage
$56,000
Outstanding Balance
$8,214
Interest Rate
8.27%
Mortgage Type
New Conventional
Estimated Equity
$120,998
Purchase Details
Closed on
Jun 3, 1982
Sold by
Bednar David
Bought by
Trinko Gerald F
Purchase Details
Closed on
Mar 1, 1979
Sold by
Nowicki Frank V and Nowicki Phyllis
Bought by
Bednar David
Purchase Details
Closed on
Jan 1, 1975
Bought by
Nowicki Frank and Nowicki Phyllis
Create a Home Valuation Report for This Property
The Home Valuation Report is an in-depth analysis detailing your home's value as well as a comparison with similar homes in the area
Home Values in the Area
Average Home Value in this Area
Purchase History
| Date | Buyer | Sale Price | Title Company |
|---|---|---|---|
| Anderson Leroy | -- | -- | |
| Anderson Leroy | -- | -- | |
| Anderson Leroy | $70,000 | -- | |
| Trinko Gerald F | $49,500 | -- | |
| Bednar David | $45,000 | -- | |
| Nowicki Frank | -- | -- |
Source: Public Records
Mortgage History
| Date | Status | Borrower | Loan Amount |
|---|---|---|---|
| Open | Anderson Leroy | $56,000 |
Source: Public Records
Tax History
| Year | Tax Paid | Tax Assessment Tax Assessment Total Assessment is a certain percentage of the fair market value that is determined by local assessors to be the total taxable value of land and additions on the property. | Land | Improvement |
|---|---|---|---|---|
| 2024 | $2,493 | $35,140 | $7,490 | $27,650 |
| 2023 | $2,173 | $24,260 | $5,920 | $18,340 |
| 2022 | $2,125 | $24,260 | $5,920 | $18,340 |
| 2021 | $2,362 | $24,260 | $5,920 | $18,340 |
| 2020 | $1,990 | $18,380 | $4,480 | $13,900 |
| 2019 | $1,790 | $52,500 | $12,800 | $39,700 |
| 2018 | $1,768 | $18,380 | $4,480 | $13,900 |
| 2017 | $1,830 | $15,900 | $2,980 | $12,920 |
| 2016 | $1,834 | $15,900 | $2,980 | $12,920 |
| 2015 | $1,673 | $15,900 | $2,980 | $12,920 |
| 2014 | $1,673 | $15,900 | $2,980 | $12,920 |
Source: Public Records
Map
Nearby Homes
- 21170 Wilmore Ave
- 21100 Nicholas Ave
- 20890 Morris Ave
- 21051 Westport Ave
- 20830 Tracy Ave
- 20801 Morris Ave
- 21250 Ball Ave
- 20751 Wilmore Ave
- 21181 Ball Ave
- 21481 Ball Ave
- 20671 Wilmore Ave
- 21130 Arbor Ave
- 20591 Ball Ave
- 20931 Priday Ave
- 21250 Milan Dr
- 828 E 216th St
- 20700 Crystal Ave
- 21051 S Lake Shore Blvd
- 20261 Fuller Ave
- 934 E 223rd St
- 21170 Morris Ave
- 21230 Morris Ave
- 21150 Morris Ave
- 21250 Morris Ave
- 21201 Tracy Ave
- 21130 Morris Ave
- 21171 Tracy Ave
- 21231 Tracy Ave
- 21270 Morris Ave
- 21151 Tracy Ave
- 21251 Tracy Ave
- 21100 Morris Ave
- 21171 Morris Ave
- 21231 Morris Ave
- 21131 Tracy Ave
- 21300 Morris Ave
- 21251 Morris Ave
- 21101 Tracy Ave
- 21070 Morris Ave
- 21131 Morris Ave
Your Personal Tour Guide
Ask me questions while you tour the home.