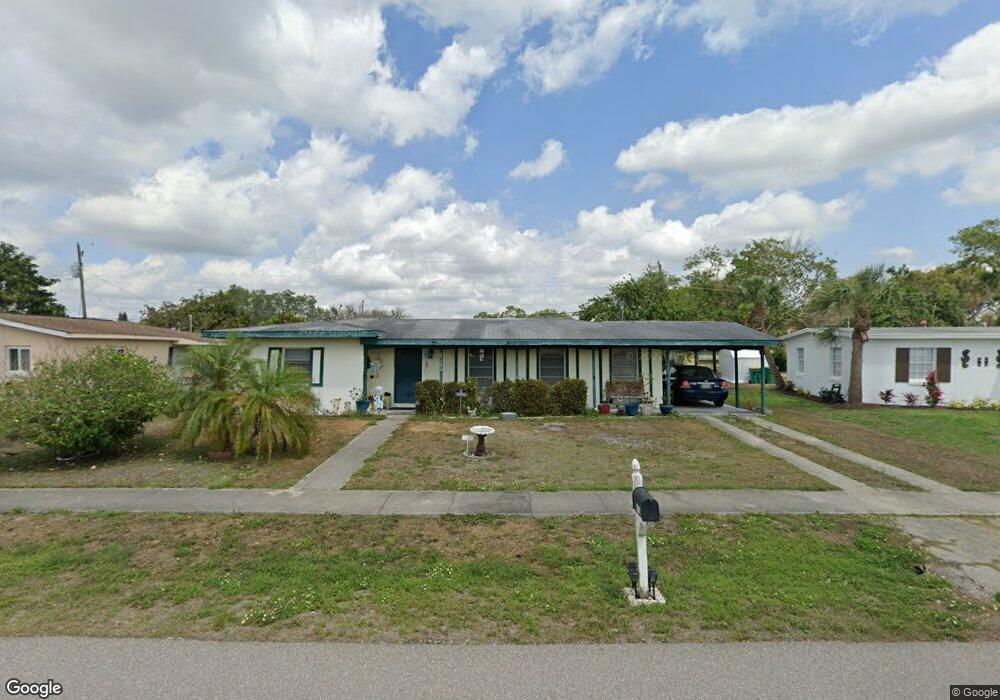
21202 Glendale Ave Port Charlotte, FL 33952
Estimated Value: $137,000 - $196,000
2
Beds
1
Bath
1,074
Sq Ft
$151/Sq Ft
Est. Value
About This Home
This home is located at 21202 Glendale Ave, Port Charlotte, FL 33952 and is currently estimated at $161,936, approximately $150 per square foot. 21202 Glendale Ave is a home located in Charlotte County with nearby schools including Neil Armstrong Elementary School, Port Charlotte Middle School, and Port Charlotte High School.
Ownership History
Date
Name
Owned For
Owner Type
Purchase Details
Closed on
Mar 7, 2012
Sold by
Price Georgiana M and Ketrow June A
Bought by
Ketrow June A
Current Estimated Value
Purchase Details
Closed on
Mar 26, 2009
Sold by
Price Georgiana M
Bought by
Price Georgiana M and Ketrow June A
Purchase Details
Closed on
Jan 5, 2004
Sold by
Lewis Nicole M
Bought by
Price Georgiana M and Myers Georgiana M
Purchase Details
Closed on
May 19, 1997
Sold by
Housing & Urban Dev
Bought by
Myers Georgiana M and Lewis Cynthia A
Home Financials for this Owner
Home Financials are based on the most recent Mortgage that was taken out on this home.
Original Mortgage
$36,043
Interest Rate
8.13%
Mortgage Type
FHA
Purchase Details
Closed on
Jan 2, 1997
Sold by
Harbourton Finl Svc L P
Bought by
Housing & Urban Dev
Purchase Details
Closed on
Dec 31, 1996
Sold by
Clerk Circuit Court
Bought by
Harbourton Finl Svc L P
Create a Home Valuation Report for This Property
The Home Valuation Report is an in-depth analysis detailing your home's value as well as a comparison with similar homes in the area
Home Values in the Area
Average Home Value in this Area
Purchase History
| Date | Buyer | Sale Price | Title Company |
|---|---|---|---|
| Ketrow June A | -- | None Available | |
| Price Georgiana M | $14,500 | None Available | |
| Price Georgiana M | -- | -- | |
| Price Georgiana M | -- | -- | |
| Myers Georgiana M | $36,400 | -- | |
| Housing & Urban Dev | -- | -- | |
| Harbourton Finl Svc L P | $53,000 | -- |
Source: Public Records
Mortgage History
| Date | Status | Borrower | Loan Amount |
|---|---|---|---|
| Previous Owner | Myers Georgiana M | $36,043 |
Source: Public Records
Tax History Compared to Growth
Tax History
| Year | Tax Paid | Tax Assessment Tax Assessment Total Assessment is a certain percentage of the fair market value that is determined by local assessors to be the total taxable value of land and additions on the property. | Land | Improvement |
|---|---|---|---|---|
| 2023 | $715 | $27,696 | $0 | $0 |
| 2022 | $695 | $26,889 | $0 | $0 |
| 2021 | $673 | $26,106 | $0 | $0 |
| 2020 | $635 | $25,746 | $0 | $0 |
| 2019 | $568 | $25,167 | $0 | $0 |
| 2018 | $518 | $24,698 | $0 | $0 |
| 2017 | $511 | $24,190 | $0 | $0 |
| 2016 | $505 | $23,692 | $0 | $0 |
| 2015 | $481 | $23,527 | $0 | $0 |
| 2014 | $461 | $23,340 | $0 | $0 |
Source: Public Records
Map
Nearby Homes
- 21162 Meehan Ave
- 21203 Meehan Ave
- 2102 Alaric St
- 21227 Gladis Ave
- 21290 Glendale Ave
- 21274 Gladis Ave
- 2126 Hanby St
- 21327 Midway Blvd
- 21066 Midway Blvd
- 1630 Viscaya Dr
- 21330 Meehan Ave
- 21042 Gladis Ave
- 2116 Hanson St
- 1505 Kenmore St
- 21034 Midway Blvd
- 21275 Austin Ave
- 21242 Coulton Ave
- 21266 Coulton Ave
- 21274 Coulton Ave
- 2217 Ednor St
- 21210 Glendale Ave
- 21218 Glendale Ave
- 21194 Glendale Ave
- 21211 Glendale Ave
- 21203 Glendale Ave
- 21203 Midway Blvd
- 21219 Midway Blvd
- 21219 Glendale Ave
- 21195 Glendale Ave
- 21226 Glendale Ave
- 21197 Midway Blvd
- 21186 Glendale Ave
- 21227 Midway Blvd
- 21227 Glendale Ave
- 21187 Glendale Ave
- 21210 Meehan Ave
- 21202 Meehan Ave
- 21189 Midway Blvd
- 21234 Glendale Ave
- 21218 Meehan Ave