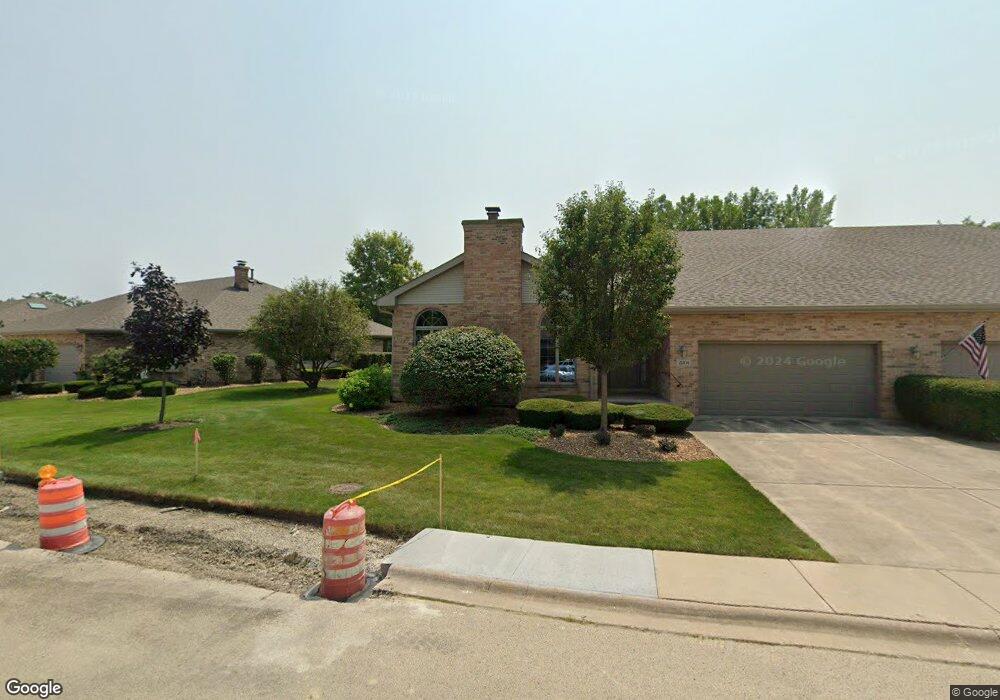
21204 Arbour Walk Dr Unit 1 Frankfort, IL 60423
North Frankfort NeighborhoodEstimated Value: $451,000 - $570,000
2
Beds
3
Baths
2,265
Sq Ft
$214/Sq Ft
Est. Value
About This Home
This home is located at 21204 Arbour Walk Dr Unit 1, Frankfort, IL 60423 and is currently estimated at $484,072, approximately $213 per square foot. 21204 Arbour Walk Dr Unit 1 is a home located in Will County with nearby schools including Grand Prairie Elementary School, Chelsea Intermediate School, and Hickory Creek Middle School.
Ownership History
Date
Name
Owned For
Owner Type
Purchase Details
Closed on
Jun 3, 2024
Sold by
Renner Richard C
Bought by
Richard C Renner Living Trust and Renner
Current Estimated Value
Purchase Details
Closed on
Mar 26, 2004
Sold by
Griffith James E
Bought by
Renner Richard C and Renner Luise H
Purchase Details
Closed on
Oct 24, 2000
Sold by
Diluigi Michael W and Diluigi Vicki R
Bought by
Griffith James E
Purchase Details
Closed on
May 15, 1997
Sold by
Nlsb
Bought by
Diluigi Michael W and Diluigi Vickie R
Home Financials for this Owner
Home Financials are based on the most recent Mortgage that was taken out on this home.
Original Mortgage
$186,400
Interest Rate
7.75%
Create a Home Valuation Report for This Property
The Home Valuation Report is an in-depth analysis detailing your home's value as well as a comparison with similar homes in the area
Home Values in the Area
Average Home Value in this Area
Purchase History
| Date | Buyer | Sale Price | Title Company |
|---|---|---|---|
| Richard C Renner Living Trust | -- | None Listed On Document | |
| Renner Richard C | $320,000 | Fatic | |
| Griffith James E | $253,500 | -- | |
| Diluigi Michael W | $228,000 | -- |
Source: Public Records
Mortgage History
| Date | Status | Borrower | Loan Amount |
|---|---|---|---|
| Previous Owner | Diluigi Michael W | $186,400 | |
| Closed | Diluigi Michael W | $23,300 |
Source: Public Records
Tax History Compared to Growth
Tax History
| Year | Tax Paid | Tax Assessment Tax Assessment Total Assessment is a certain percentage of the fair market value that is determined by local assessors to be the total taxable value of land and additions on the property. | Land | Improvement |
|---|---|---|---|---|
| 2024 | $10,417 | $147,480 | $780 | $146,700 |
| 2023 | $10,417 | $131,714 | $697 | $131,017 |
| 2022 | $6,521 | $119,969 | $635 | $119,334 |
| 2021 | $7,052 | $112,236 | $594 | $111,642 |
| 2020 | $7,087 | $109,073 | $577 | $108,496 |
| 2019 | $7,058 | $106,154 | $562 | $105,592 |
| 2018 | $7,149 | $103,102 | $546 | $102,556 |
| 2017 | $7,996 | $100,695 | $533 | $100,162 |
| 2016 | $7,422 | $97,243 | $515 | $96,728 |
| 2015 | $7,860 | $93,819 | $497 | $93,322 |
| 2014 | $7,860 | $93,167 | $494 | $92,673 |
| 2013 | $7,860 | $98,675 | $1,986 | $96,689 |
Source: Public Records
Map
Nearby Homes
- 21213 S 93rd Ave
- 21203 S 93rd Ave
- 21160 S 93rd Ave
- 8899 Charrington Dr
- 9378 Fox Run Cir Unit 21B
- 21413 Chadwick Ct
- 9293 Vesper Ln
- 9335 Fox Run Cir
- 20644 Grand Haven Dr
- 130 Evergreen Dr
- Lot 3 Town Center Dr
- 8675 Saddlebred Ct Unit 51
- 8667 Saddlebred Ct Unit 10-3
- 21341 Windy Hill Dr Unit 1
- 20665 Grand Haven Dr
- 21437 Breton Rd
- 21466 English Cir
- 9724 Folkers Dr
- 9736 Folkers Dr
- 8638 Saddlebred Ct Unit 24
- 21210 Arbour Walk Dr
- 21202 Arbour Walk Dr
- 21212 Arbour Walk Dr
- 21196 Arbour Walk Dr
- 21196 Arbour Walk Dr Unit 2119
- 21184 Raintree Ct
- 21222 Arbour Walk Dr
- 21203 Arbour Walk Dr
- 21177 Arbour Walk Dr
- 21194 Arbour Walk Dr
- 21182 Raintree Ct
- 21205 Arbour Walk Dr
- 21224 Arbour Walk Dr
- 21180 Arbour Walk Dr
- 21227 Arbour Walk Dr
- 21175 Arbour Walk Dr
- 21164 Raintree Ct Unit 1
- 9123 Raintree Ln
- 21236 Arbour Walk Dr
- 21178 Arbour Walk Dr