
Seller's Agent in 2025
Evelyn Heirigs
RE/MAX
(708) 923-0900
1 in this area
30 Total Sales

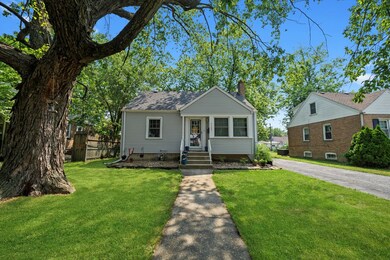
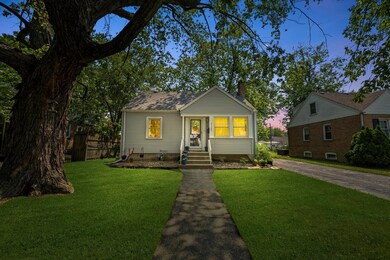
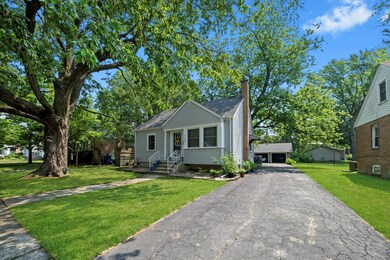
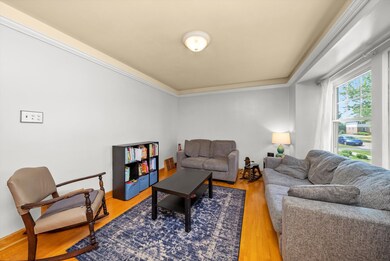
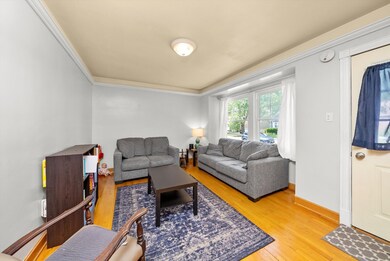
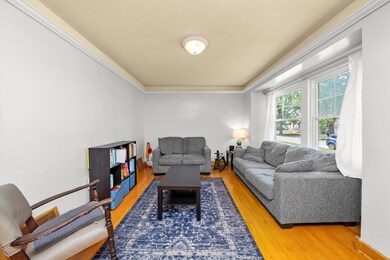
Step into this updated and well-maintained Cape Cod filled with natural light and beauty. Hardwood floors flow throughout the main living spaces, and a newer kitchen makes cooking and gathering a pleasure. The spacious family room is perfect for relaxing or entertaining. Enjoy the convenience of a bathroom on every level and a thoughtfully finished lower level with epoxied floors that adds extra flexible space including an office. The first-floor primary bedroom provides easy access and comfort. Outside, a side drive leads to a two-car garage and a generously sized yard, ideal for outdoor enjoyment. This move-in ready home also features many recent updates, including a new A/C (2022), newer roof, gutter guards, furnace, and siding (2023). Situated in a peaceful neighborhood with easy access to the Metra and expressway, this home offers both comfort and convenience.
Last Agent to Sell the Property
RE/MAX 10 in the Park License #475189318 Listed on: 07/15/2025
| Date | Type | Sale Price | Title Company |
|---|---|---|---|
| Warranty Deed | $215,000 | Fidelity National Title Compan | |
| Warranty Deed | $132,000 | Citywide Title Corporation | |
| Warranty Deed | $134,500 | Pntn |
| Date | Status | Loan Amount | Loan Type |
|---|---|---|---|
| Open | $196,886 | FHA | |
| Previous Owner | $122,400 | New Conventional | |
| Previous Owner | $131,918 | FHA |
| Date | Event | Price | List to Sale | Price per Sq Ft |
|---|---|---|---|---|
| 09/02/2025 09/02/25 | Sold | $215,000 | 0.0% | $179 / Sq Ft |
| 07/30/2025 07/30/25 | Pending | -- | -- | -- |
| 07/15/2025 07/15/25 | For Sale | $215,000 | -- | $179 / Sq Ft |
| Year | Tax Paid | Tax Assessment Tax Assessment Total Assessment is a certain percentage of the fair market value that is determined by local assessors to be the total taxable value of land and additions on the property. | Land | Improvement |
|---|---|---|---|---|
| 2024 | $4,672 | $14,620 | $2,860 | $11,760 |
| 2023 | $2,757 | $14,620 | $2,860 | $11,760 |
| 2022 | $2,757 | $8,504 | $2,503 | $6,001 |
| 2021 | $2,844 | $8,502 | $2,502 | $6,000 |
| 2020 | $2,750 | $8,502 | $2,502 | $6,000 |
| 2019 | $3,023 | $9,271 | $2,323 | $6,948 |
| 2018 | $3,020 | $9,271 | $2,323 | $6,948 |
| 2017 | $2,929 | $9,271 | $2,323 | $6,948 |
| 2016 | $3,266 | $9,139 | $2,145 | $6,994 |
| 2015 | $3,176 | $9,139 | $2,145 | $6,994 |
| 2014 | $3,103 | $9,139 | $2,145 | $6,994 |
| 2013 | $3,674 | $11,142 | $2,145 | $8,997 |
Seller's Agent in 2025
Evelyn Heirigs
RE/MAX
(708) 923-0900
1 in this area
30 Total Sales
Buyer's Agent in 2025
Valerie Thomas
Red Pro Realty
(773) 593-3696
1 in this area
10 Total Sales
Source: Midwest Real Estate Data (MRED)
MLS Number: 12402841
APN: 31-23-312-010-0000
Disclaimer: Certain information contained herein is derived from information provided by parties other than Homes.com. All information provided is deemed reliable, but is not guaranteed to be accurate and should be independently verified.
![]() Based on information submitted to the MLS GRID. All data is obtained from various sources and may not have been verified by broker or MLS GRID. Supplied Open House Information is subject to change without notice. All information should be independently reviewed and verified for accuracy. Properties may or may not be listed by the office/agent presenting the information. Some IDX listings have been excluded from this website.
Based on information submitted to the MLS GRID. All data is obtained from various sources and may not have been verified by broker or MLS GRID. Supplied Open House Information is subject to change without notice. All information should be independently reviewed and verified for accuracy. Properties may or may not be listed by the office/agent presenting the information. Some IDX listings have been excluded from this website.
The Digital Millennium Copyright Act of 1998, 17 U.S.C. § 512 (the “DMCA”) provides recourse for copyright owners who believe that material appearing on the Internet infringes their rights under U.S. copyright law. If you believe in good faith that any content or material made available in connection with our website or services infringes your copyright, you (or your agent) may send us a notice requesting that the content or material be removed, or access to it blocked.
Notices must be sent in writing by email to DMCAnotice@MLSGrid.com.
The DMCA requires that your notice of alleged copyright infringement include the following information:
(1) description of the copyrighted work that is the subject of claimed infringement;
(2) description of the alleged infringing content and information sufficient to permit us to locate the content;
(3) contact information for you, including your address, telephone number and email address;
(4) a statement by you that you have a good faith belief that the content in the manner complained of is not authorized by the copyright owner, or its agent, or by the operation of any law;
(5) a statement by you, signed under penalty of perjury, that the information in the notification is accurate and that you have the authority to enforce the copyrights that are claimed to be infringed; and
(6) a physical or electronic signature of the copyright owner or a person authorized to act on the copyright owner’s behalf. Failure to include all of the above information may result in the delay of the processing of your complaint.