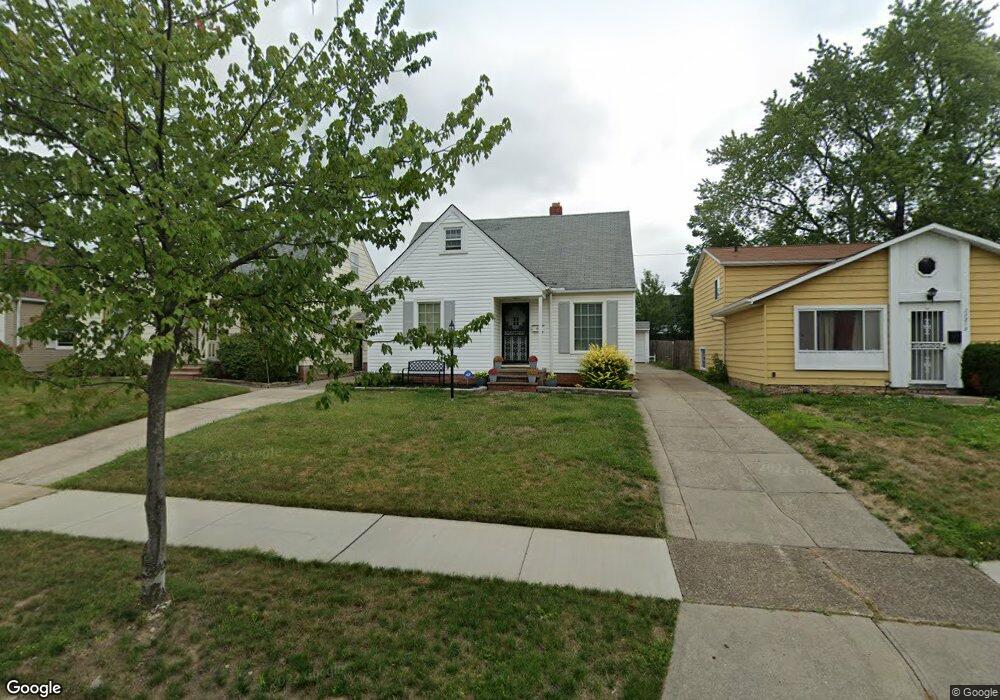
21209 Gardenview Dr Maple Heights, OH 44137
Estimated Value: $106,891 - $160,000
3
Beds
1
Bath
1,209
Sq Ft
$102/Sq Ft
Est. Value
About This Home
This home is located at 21209 Gardenview Dr, Maple Heights, OH 44137 and is currently estimated at $122,973, approximately $101 per square foot. 21209 Gardenview Dr is a home located in Cuyahoga County with nearby schools including Abraham Lincoln Elementary School, Rockside/ J.F. Kennedy School, and Italy High School.
Ownership History
Date
Name
Owned For
Owner Type
Purchase Details
Closed on
Oct 17, 2006
Sold by
Rozier Linda D
Bought by
Horton Mary
Current Estimated Value
Home Financials for this Owner
Home Financials are based on the most recent Mortgage that was taken out on this home.
Original Mortgage
$14,625
Outstanding Balance
$8,722
Interest Rate
6.45%
Mortgage Type
Credit Line Revolving
Estimated Equity
$114,251
Purchase Details
Closed on
Nov 23, 1998
Sold by
Stills Debra R
Bought by
Rozier Linda D
Home Financials for this Owner
Home Financials are based on the most recent Mortgage that was taken out on this home.
Original Mortgage
$64,600
Interest Rate
7.01%
Purchase Details
Closed on
Oct 3, 1991
Sold by
Pulling Marilyn
Bought by
Baum Marilyn
Purchase Details
Closed on
Feb 12, 1987
Sold by
Obradovic Julia
Bought by
Pulling Marilyn
Purchase Details
Closed on
Jan 1, 1975
Bought by
Obradovic Julia
Create a Home Valuation Report for This Property
The Home Valuation Report is an in-depth analysis detailing your home's value as well as a comparison with similar homes in the area
Home Values in the Area
Average Home Value in this Area
Purchase History
| Date | Buyer | Sale Price | Title Company |
|---|---|---|---|
| Horton Mary | $97,500 | Real Living Title Agency L | |
| Rozier Linda D | $76,000 | Midland Title Security Inc | |
| Baum Marilyn | -- | -- | |
| Stills Debra R | $54,000 | -- | |
| Pulling Marilyn | $46,000 | -- | |
| Obradovic Julia | -- | -- |
Source: Public Records
Mortgage History
| Date | Status | Borrower | Loan Amount |
|---|---|---|---|
| Open | Horton Mary | $14,625 | |
| Open | Horton Mary | $78,000 | |
| Previous Owner | Rozier Linda D | $64,600 |
Source: Public Records
Tax History Compared to Growth
Tax History
| Year | Tax Paid | Tax Assessment Tax Assessment Total Assessment is a certain percentage of the fair market value that is determined by local assessors to be the total taxable value of land and additions on the property. | Land | Improvement |
|---|---|---|---|---|
| 2024 | $3,272 | $36,365 | $6,720 | $29,645 |
| 2023 | $2,209 | $20,410 | $4,060 | $16,350 |
| 2022 | $2,201 | $20,410 | $4,060 | $16,350 |
| 2021 | $2,345 | $20,410 | $4,060 | $16,350 |
| 2020 | $2,008 | $15,470 | $3,080 | $12,390 |
| 2019 | $1,997 | $44,200 | $8,800 | $35,400 |
| 2018 | $1,986 | $15,470 | $3,080 | $12,390 |
| 2017 | $1,899 | $14,320 | $2,870 | $11,450 |
| 2016 | $1,837 | $14,320 | $2,870 | $11,450 |
| 2015 | $1,831 | $14,320 | $2,870 | $11,450 |
| 2014 | $1,831 | $15,720 | $3,150 | $12,570 |
Source: Public Records
Map
Nearby Homes
- 21416 Gardenview Dr
- 20814 Kenyon Dr
- 20701 Kenyon Dr
- 21207 Franklin Rd
- 20510 Mountville Dr
- 21102 Raymond St
- 20814 Watson Rd
- 20750 Bowling Green Rd
- 20907 Watson Rd
- 20107 Libby Rd
- 20715 Watson Rd
- 20732 Applegate Rd
- 5285 Mardale Ave
- 5301 Mardale Ave
- 20625 Centuryway Rd
- 20739 Donny Brook Rd
- 19812 Stockton Ave
- 19806 Mountville Dr
- 19807 Gardenview Dr
- 20120 Mccracken Rd
- 21205 Gardenview Dr
- 21213 Gardenview Dr
- 21217 Gardenview Dr
- 21203 Gardenview Dr
- 21301 Gardenview Dr
- 21210 Kenyon Dr
- 21214 Kenyon Dr
- 21206 Kenyon Dr
- 21218 Kenyon Dr
- 21202 Kenyon Dr
- 21305 Gardenview Dr
- 21210 Gardenview Dr
- 21302 Kenyon Dr
- 21214 Gardenview Dr
- 21206 Gardenview Dr
- 21218 Gardenview Dr
- 21202 Gardenview Dr
- 21309 Gardenview Dr
- 21306 Kenyon Dr
- 21302 Gardenview Dr