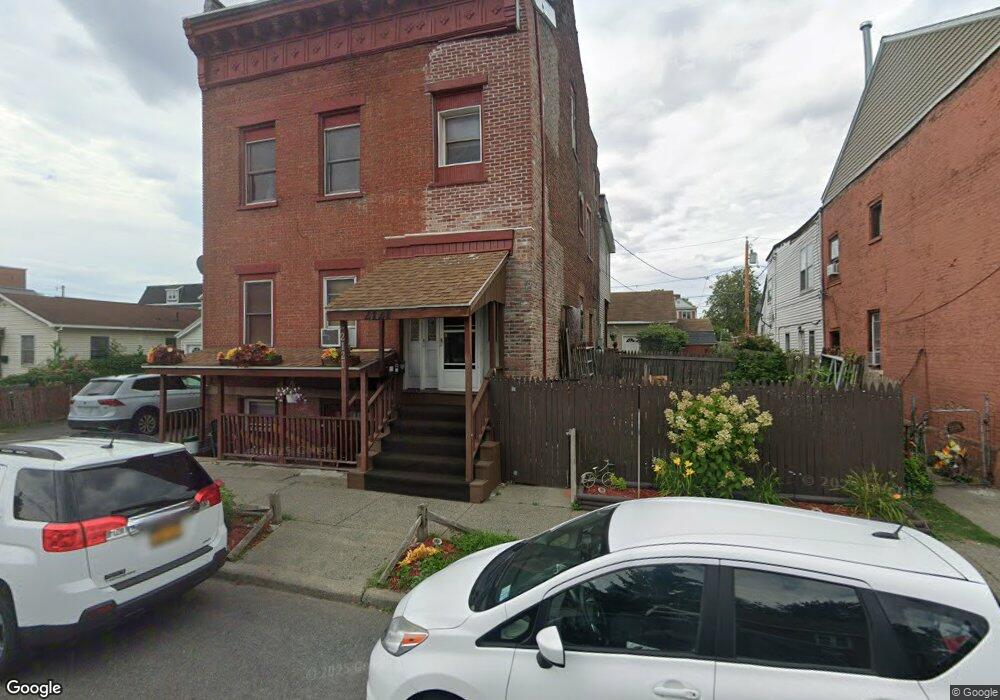
2121 2nd Ave Watervliet, NY 12189
Estimated Value: $195,084 - $333,000
5
Beds
2
Baths
3,000
Sq Ft
$80/Sq Ft
Est. Value
About This Home
This home is located at 2121 2nd Ave, Watervliet, NY 12189 and is currently estimated at $240,771, approximately $80 per square foot. 2121 2nd Ave is a home located in Albany County with nearby schools including Watervliet Elementary School, Watervliet Junior/Senior High School, and KIPP Troy Prep High School.
Ownership History
Date
Name
Owned For
Owner Type
Purchase Details
Closed on
Apr 9, 2010
Sold by
Gordon Kenneth
Bought by
Maloney Colleen A
Current Estimated Value
Home Financials for this Owner
Home Financials are based on the most recent Mortgage that was taken out on this home.
Original Mortgage
$108,007
Outstanding Balance
$73,695
Interest Rate
5.5%
Mortgage Type
FHA
Estimated Equity
$167,076
Purchase Details
Closed on
Aug 8, 1998
Sold by
Seaver David and Seaver Jean
Bought by
Gordon Kenenth
Create a Home Valuation Report for This Property
The Home Valuation Report is an in-depth analysis detailing your home's value as well as a comparison with similar homes in the area
Home Values in the Area
Average Home Value in this Area
Purchase History
| Date | Buyer | Sale Price | Title Company |
|---|---|---|---|
| Maloney Colleen A | $110,000 | Sneeringer Monahan Provost R | |
| Gordon Kenenth | $18,800 | -- |
Source: Public Records
Mortgage History
| Date | Status | Borrower | Loan Amount |
|---|---|---|---|
| Open | Maloney Colleen A | $108,007 |
Source: Public Records
Tax History Compared to Growth
Tax History
| Year | Tax Paid | Tax Assessment Tax Assessment Total Assessment is a certain percentage of the fair market value that is determined by local assessors to be the total taxable value of land and additions on the property. | Land | Improvement |
|---|---|---|---|---|
| 2024 | $5,432 | $122,200 | $28,800 | $93,400 |
| 2023 | $5,400 | $122,200 | $28,800 | $93,400 |
| 2022 | $3,828 | $122,200 | $28,800 | $93,400 |
| 2021 | $3,785 | $122,200 | $28,800 | $93,400 |
| 2020 | $5,548 | $122,200 | $28,800 | $93,400 |
| 2019 | $3,791 | $122,200 | $28,800 | $93,400 |
| 2018 | $4,483 | $122,200 | $28,800 | $93,400 |
| 2017 | $3,560 | $122,200 | $28,800 | $93,400 |
| 2016 | $5,038 | $122,200 | $28,800 | $93,400 |
| 2015 | -- | $149,200 | $28,800 | $120,400 |
| 2014 | -- | $149,200 | $28,800 | $120,400 |
Source: Public Records
Map
Nearby Homes