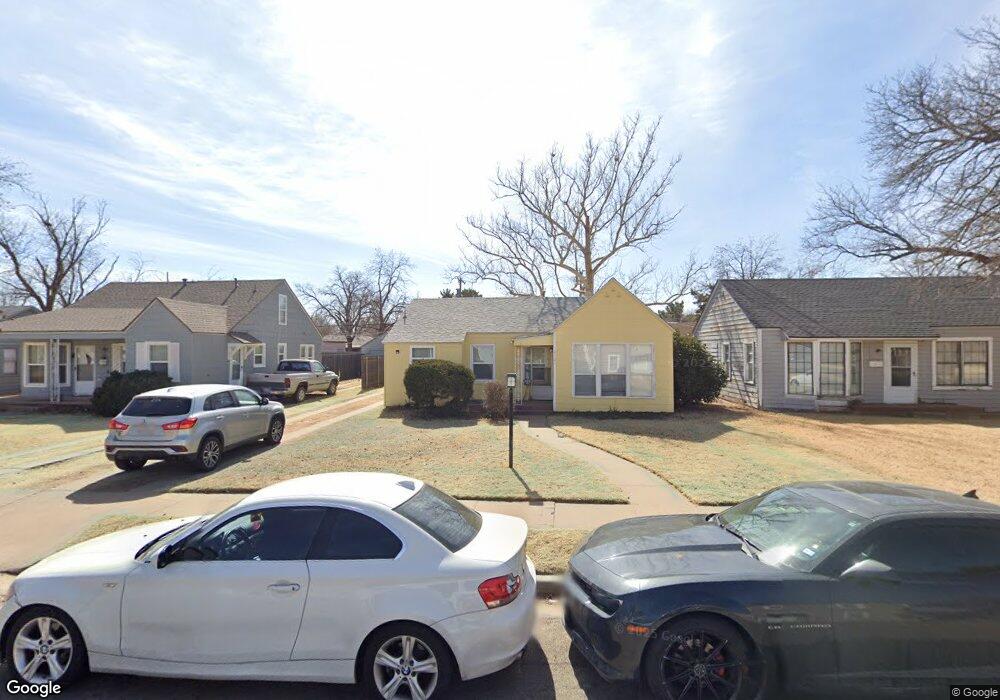
2121 30th St Lubbock, TX 79411
Heart of Lubbock NeighborhoodEstimated Value: $94,000 - $127,000
2
Beds
1
Bath
958
Sq Ft
$113/Sq Ft
Est. Value
About This Home
This home is located at 2121 30th St, Lubbock, TX 79411 and is currently estimated at $107,818, approximately $112 per square foot. 2121 30th St is a home located in Lubbock County with nearby schools including Brown Elementary School, Slaton Middle School, and Monterey High School.
Ownership History
Date
Name
Owned For
Owner Type
Purchase Details
Closed on
May 9, 2020
Sold by
Key Mark A and Key Cynthia D
Bought by
Harvard 30 Llc
Current Estimated Value
Purchase Details
Closed on
Apr 13, 2006
Sold by
Denike David L and Denike Marzetta
Bought by
Key Cynthia
Purchase Details
Closed on
Aug 1, 1994
Sold by
Landes Russell Wayne
Bought by
Key Cynthia
Purchase Details
Closed on
Aug 25, 1992
Sold by
Cogburn Danny L
Bought by
Key Cynthia
Create a Home Valuation Report for This Property
The Home Valuation Report is an in-depth analysis detailing your home's value as well as a comparison with similar homes in the area
Home Values in the Area
Average Home Value in this Area
Purchase History
| Date | Buyer | Sale Price | Title Company |
|---|---|---|---|
| Harvard 30 Llc | -- | None Listed On Document | |
| Key Cynthia | -- | -- | |
| Key Cynthia | -- | -- | |
| Key Cynthia | -- | -- |
Source: Public Records
Tax History
| Year | Tax Paid | Tax Assessment Tax Assessment Total Assessment is a certain percentage of the fair market value that is determined by local assessors to be the total taxable value of land and additions on the property. | Land | Improvement |
|---|---|---|---|---|
| 2025 | $1,742 | $85,000 | $25,000 | $60,000 |
| 2024 | $17 | $100,423 | $25,000 | $75,423 |
| 2023 | $1,486 | $79,931 | $13,650 | $66,281 |
| 2022 | $1,518 | $74,979 | $13,650 | $61,329 |
| 2021 | $1,242 | $57,976 | $13,650 | $44,326 |
| 2020 | $1,478 | $67,982 | $13,650 | $54,332 |
| 2019 | $1,339 | $59,624 | $13,650 | $45,974 |
| 2018 | $1,387 | $61,713 | $13,650 | $48,063 |
| 2017 | $1,191 | $52,903 | $2,750 | $50,153 |
| 2016 | $1,134 | $50,395 | $2,750 | $47,645 |
| 2015 | $1,044 | $49,615 | $2,750 | $46,865 |
| 2014 | $1,044 | $46,955 | $2,750 | $44,205 |
Source: Public Records
Map
Nearby Homes
Your Personal Tour Guide
Ask me questions while you tour the home.