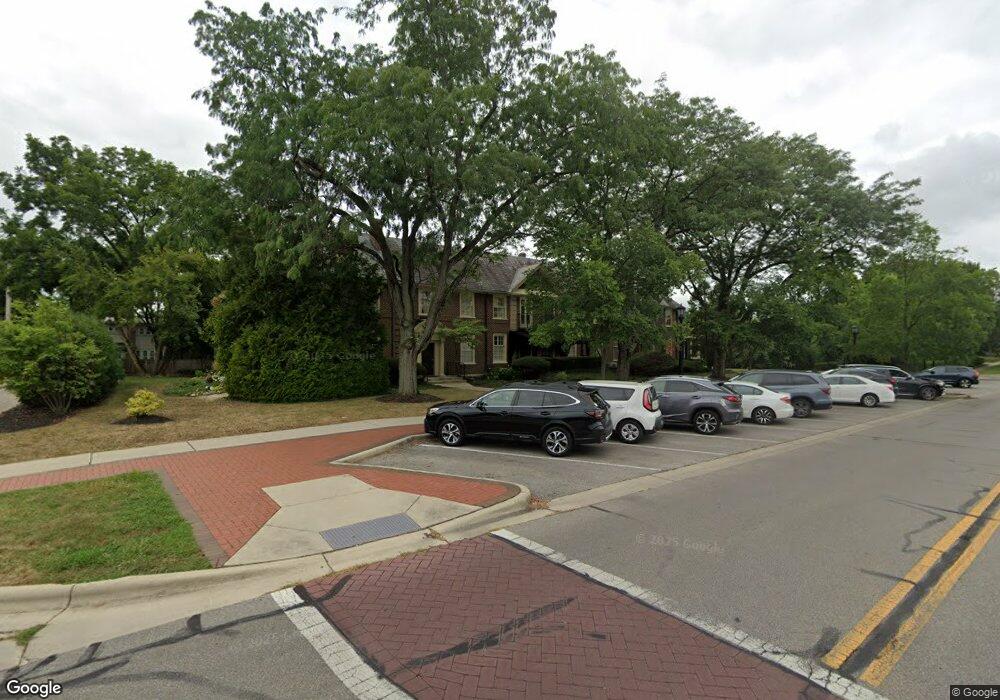
2121 Arlington Ave Unit P19 Columbus, OH 43221
Estimated Value: $258,481 - $328,000
2
Beds
1
Bath
886
Sq Ft
$326/Sq Ft
Est. Value
About This Home
This home is located at 2121 Arlington Ave Unit P19, Columbus, OH 43221 and is currently estimated at $288,620, approximately $325 per square foot. 2121 Arlington Ave Unit P19 is a home located in Franklin County with nearby schools including Barrington Road Elementary School, Jones Middle School, and Upper Arlington High School.
Ownership History
Date
Name
Owned For
Owner Type
Purchase Details
Closed on
Jan 30, 2006
Sold by
Thomas Karen Y
Bought by
Dale Carole J
Current Estimated Value
Home Financials for this Owner
Home Financials are based on the most recent Mortgage that was taken out on this home.
Original Mortgage
$275,000
Outstanding Balance
$151,771
Interest Rate
5.87%
Mortgage Type
Fannie Mae Freddie Mac
Estimated Equity
$136,849
Purchase Details
Closed on
Jun 30, 2003
Sold by
Brownfield Lillian T
Bought by
Thomas Karen Y
Home Financials for this Owner
Home Financials are based on the most recent Mortgage that was taken out on this home.
Original Mortgage
$85,600
Interest Rate
5.4%
Mortgage Type
Purchase Money Mortgage
Purchase Details
Closed on
Nov 25, 1977
Bought by
Brownfield Lillian T
Create a Home Valuation Report for This Property
The Home Valuation Report is an in-depth analysis detailing your home's value as well as a comparison with similar homes in the area
Home Values in the Area
Average Home Value in this Area
Purchase History
| Date | Buyer | Sale Price | Title Company |
|---|---|---|---|
| Dale Carole J | $135,000 | Title First | |
| Thomas Karen Y | $107,000 | Worthington Title | |
| Brownfield Lillian T | $43,000 | -- |
Source: Public Records
Mortgage History
| Date | Status | Borrower | Loan Amount |
|---|---|---|---|
| Open | Dale Carole J | $275,000 | |
| Previous Owner | Thomas Karen Y | $85,600 |
Source: Public Records
Tax History Compared to Growth
Tax History
| Year | Tax Paid | Tax Assessment Tax Assessment Total Assessment is a certain percentage of the fair market value that is determined by local assessors to be the total taxable value of land and additions on the property. | Land | Improvement |
|---|---|---|---|---|
| 2024 | $3,826 | $75,880 | $14,700 | $61,180 |
| 2023 | $3,814 | $75,880 | $14,700 | $61,180 |
| 2022 | $4,263 | $69,760 | $20,130 | $49,630 |
| 2021 | $3,774 | $69,760 | $20,130 | $49,630 |
| 2020 | $3,740 | $69,760 | $20,130 | $49,630 |
| 2019 | $3,600 | $60,660 | $17,500 | $43,160 |
| 2018 | $2,903 | $60,660 | $17,500 | $43,160 |
| 2017 | $2,900 | $60,660 | $17,500 | $43,160 |
| 2016 | $2,229 | $42,460 | $10,610 | $31,850 |
| 2015 | $2,227 | $42,460 | $10,610 | $31,850 |
| 2014 | $2,229 | $42,460 | $10,610 | $31,850 |
| 2013 | $1,036 | $38,570 | $9,625 | $28,945 |
Source: Public Records
Map
Nearby Homes
- 2063 Westover Rd
- 1869 Tewksbury Rd
- 2110 Northwest Blvd
- 1782 Wyandotte Rd
- 1914 Elmwood Ave
- 1631 Roxbury Rd Unit F3
- 1631 Roxbury Rd Unit B6
- 2015 W 5th Ave Unit 211
- 2015 W 5th Ave Unit 102
- 2015 W 5th Ave Unit 108
- 1535 Doone Rd
- 1733 Elmwood Ave
- 2583 Wexford Rd
- 1565 Berkshire Rd
- 1561 Glenn Ave
- 1661 Ashland Ave Unit 663
- 2170 Lane Woods Dr Unit 2170
- 1398 Lower Green Cir Unit 1398
- 1459 Elmwood Ave Unit 1459
- 2704 Scioto Station Dr Unit 2704
- 2121 Arlington Ave Unit 1
- 2121 Arlington Ave
- 2121 Arlington Ave Unit 10
- 2121 Arlington Ave Unit P21
- 2121 Arlington Ave Unit P22
- 2121 Arlington Ave Unit 2
- 2121 Arlington Ave Unit 3
- 2121 Arlington Ave
- 2121 Arlington Ave
- 2121 Arlington Ave Unit 7
- 2121 Arlington Ave Unit 8
- 2121 Arlington Ave Unit 12
- 2121 Arlington Ave Unit 5
- 2121 Arlington Ave Unit 9
- 2121 Arlington Ave Unit 6
- 2025 Guilford Rd
- 2088 Fairfax Rd
- 2026 Guilford Rd
- 2076 Fairfax Rd
- 2124 Arlington Ave Unit 1