Estimated Value: $363,596 - $434,000
3
Beds
2
Baths
1,876
Sq Ft
$208/Sq Ft
Est. Value
About This Home
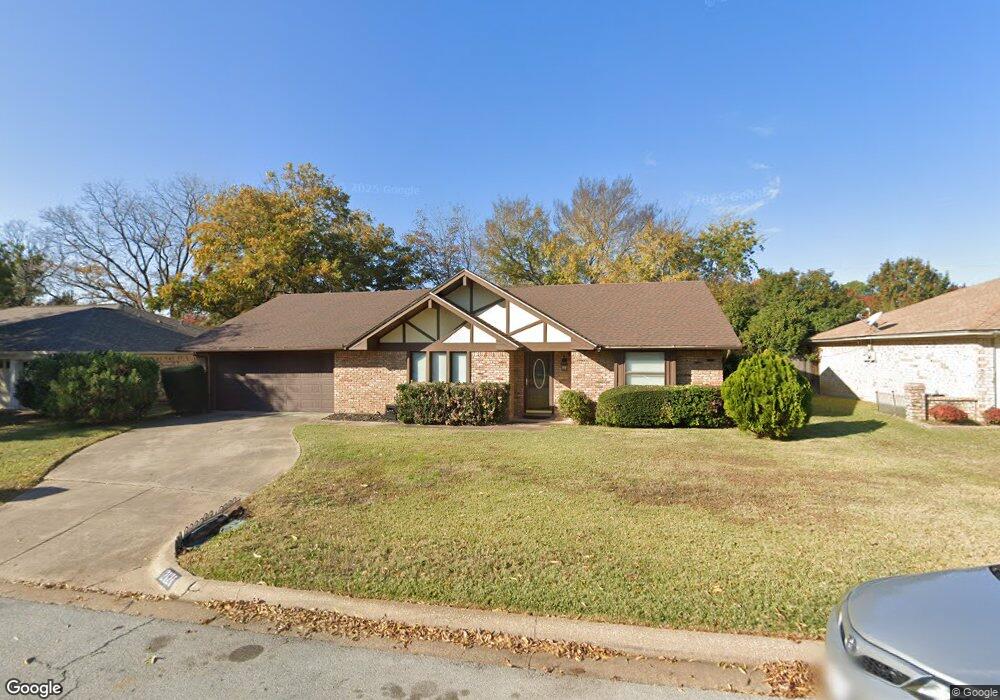
This home is located at 2121 Cannon Dr, Hurst, TX 76054 and is currently estimated at $389,899, approximately $207 per square foot. 2121 Cannon Dr is a home located in Tarrant County with nearby schools including Bedford Heights Elementary School, Bedford Junior High School, and L.D. Bell High School.
Create a Home Valuation Report for This Property
The Home Valuation Report is an in-depth analysis detailing your home's value as well as a comparison with similar homes in the area
Home Values in the Area
Average Home Value in this Area
Tax History
| Year | Tax Paid | Tax Assessment Tax Assessment Total Assessment is a certain percentage of the fair market value that is determined by local assessors to be the total taxable value of land and additions on the property. | Land | Improvement |
|---|---|---|---|---|
| 2025 | $1,856 | $346,924 | $75,000 | $271,924 |
| 2024 | $1,856 | $346,924 | $75,000 | $271,924 |
| 2023 | $6,553 | $349,225 | $55,000 | $294,225 |
| 2022 | $6,847 | $309,311 | $55,000 | $254,311 |
| 2021 | $6,520 | $277,685 | $55,000 | $222,685 |
| 2020 | $5,913 | $253,440 | $55,000 | $198,440 |
| 2019 | $5,468 | $264,273 | $55,000 | $209,273 |
| 2018 | $4,354 | $203,111 | $55,000 | $148,111 |
| 2017 | $4,673 | $203,023 | $18,000 | $185,023 |
| 2016 | $4,248 | $190,602 | $18,000 | $172,602 |
| 2015 | $3,542 | $152,600 | $18,000 | $134,600 |
| 2014 | $3,542 | $152,600 | $18,000 | $134,600 |
Source: Public Records
Map
Nearby Homes
- 317 Northglen Dr
- 404 Mountainview Dr
- 421 Cavender Ct
- 2204 Mountainview Dr
- 200 Eagle Ct
- 2244 Hurstview Dr
- 617 Indian Trail
- 2157 Lookout Ct
- 3006 Carolyn Ct
- 2221 Farrington Ln
- 305 Warbler Dr
- 412 Elisha Dr
- 413 Blue Jay Ct
- 440 W Louella Dr
- 410 Carolyn Dr
- 201 W Louella Dr
- 413 Baker Dr
- 2620 Brookridge Dr
- 405 Woodbriar Ct
- 1905 Cimarron Trail
- 2125 Cannon Dr
- 2117 Cannon Dr
- 313 Fairhaven Ct
- 317 Fairhaven Ct
- 239 Norwich Dr
- 2129 Cannon Dr
- 2113 Cannon Dr
- 309 Fairhaven Ct
- 2064 Normandy Dr
- 236 Norwich Dr
- 316 Fairhaven Ct
- 235 Norwich Dr
- 2109 Cannon Dr
- 301 Northglen Dr
- 305 Fairhaven Ct
- 305 Northglen Dr
- 2060 Normandy Dr
- 232 Norwich Dr
- 309 Northglen Dr
- 235 Northglen Dr
Your Personal Tour Guide
Ask me questions while you tour the home.