
Landlord's Agent in 2024
Thomas Margavio
Margavio Realty, LLC.
(404) 312-9955
16 Total Sales
Estimated Value: $268,000 - $292,000
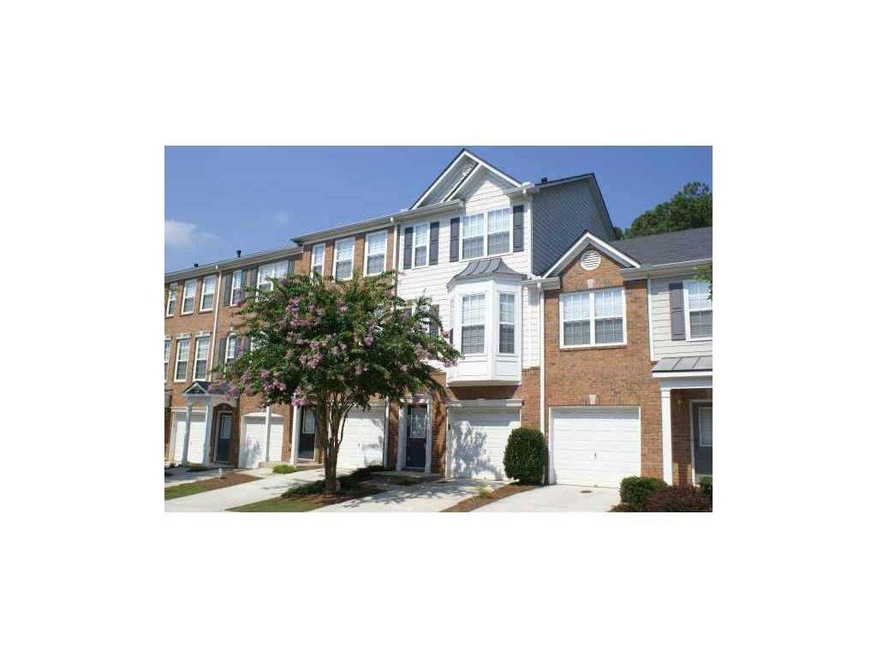
Fabulous 3-story in excellent condition. Home is TECHNICALLY 2 bedrooms with 2.5 bathrooms, BUT there is a finished basement area which can easily be a 3rd bedroom or office. Spacious, open floor plan w/ split bedrooms and private baths. Walkout basement great for recreation room, office, media room, or 3rd bedroom. ONE car garage. Gated community w/ pool. Marta accessible. Washer, dryer, and refrigerator included.
Last Agent to Rent the Property
Margavio Realty, LLC. License #259394 Listed on: 08/01/2024
| Date | Buyer | Sale Price | Title Company |
|---|---|---|---|
| Julien Wondra | $142,100 | -- |
| Date | Status | Borrower | Loan Amount |
|---|---|---|---|
| Open | Julien Wondra | $139,864 |
| Date | Event | Price | List to Sale | Price per Sq Ft |
|---|---|---|---|---|
| 08/11/2024 08/11/24 | Rented | $1,850 | 0.0% | -- |
| 08/01/2024 08/01/24 | For Rent | $1,850 | +23.3% | -- |
| 07/24/2017 07/24/17 | Rented | $1,500 | 0.0% | -- |
| 07/15/2017 07/15/17 | For Rent | $1,500 | +46.3% | -- |
| 02/10/2016 02/10/16 | Rented | $1,025 | +2.5% | -- |
| 01/11/2016 01/11/16 | Under Contract | -- | -- | -- |
| 06/03/2013 06/03/13 | Rented | $1,000 | -2.4% | -- |
| 06/03/2013 06/03/13 | For Rent | $1,025 | 0.0% | -- |
| 05/09/2013 05/09/13 | Rented | $1,025 | +5.1% | -- |
| 05/09/2013 05/09/13 | For Rent | $975 | -7.1% | -- |
| 07/15/2008 07/15/08 | For Rent | $1,050 | -- | -- |
| Year | Tax Paid | Tax Assessment Tax Assessment Total Assessment is a certain percentage of the fair market value that is determined by local assessors to be the total taxable value of land and additions on the property. | Land | Improvement |
|---|---|---|---|---|
| 2025 | $5,285 | $108,000 | $20,000 | $88,000 |
| 2024 | $5,090 | $105,080 | $20,000 | $85,080 |
| 2023 | $5,090 | $105,080 | $20,000 | $85,080 |
| 2022 | $3,902 | $82,440 | $14,400 | $68,040 |
| 2021 | $3,389 | $69,600 | $14,400 | $55,200 |
| 2020 | $3,203 | $66,200 | $14,400 | $51,800 |
| 2019 | $3,305 | $68,600 | $14,400 | $54,200 |
| 2018 | $2,454 | $52,640 | $10,600 | $42,040 |
| 2017 | $2,514 | $49,920 | $10,600 | $39,320 |
| 2016 | $2,425 | $47,800 | $10,600 | $37,200 |
| 2014 | $1,692 | $30,440 | $10,600 | $19,840 |
Landlord's Agent in 2024
Thomas Margavio
Margavio Realty, LLC.
(404) 312-9955
16 Total Sales
S
Seller's Agent in 2016
STACEY TRAINER
NOT A VALID MEMBER
J
Seller Co-Listing Agent in 2016
JEFFREY TRAINER
NOT A VALID MEMBER
S
Buyer's Agent in 2016
SONYA KING
NOT A VALID MEMBER
R
Buyer's Agent in 2013
RICHARD ALLEN
NOT A VALID MEMBER
Source: First Multiple Listing Service (FMLS)
MLS Number: 7434189
APN: 18-214-17-015
![]() Listings identified with the FMLS IDX logo come from FMLS and are held by brokerage firms other than the owner of this website. The listing brokerage is identified in any listing details. Information is deemed reliable but is not guaranteed. If you believe any FMLS listing contains material that infringes your copyrighted work please visit www.fmls.com/dmca to review our DMCA policy and learn how to submit a takedown request. © 2025 First Multiple Listing Service, Inc.
Listings identified with the FMLS IDX logo come from FMLS and are held by brokerage firms other than the owner of this website. The listing brokerage is identified in any listing details. Information is deemed reliable but is not guaranteed. If you believe any FMLS listing contains material that infringes your copyrighted work please visit www.fmls.com/dmca to review our DMCA policy and learn how to submit a takedown request. © 2025 First Multiple Listing Service, Inc.
Disclaimer: Certain information contained herein is derived from information provided by parties other than Homes.com. All information provided is deemed reliable, but is not guaranteed to be accurate and should be independently verified.