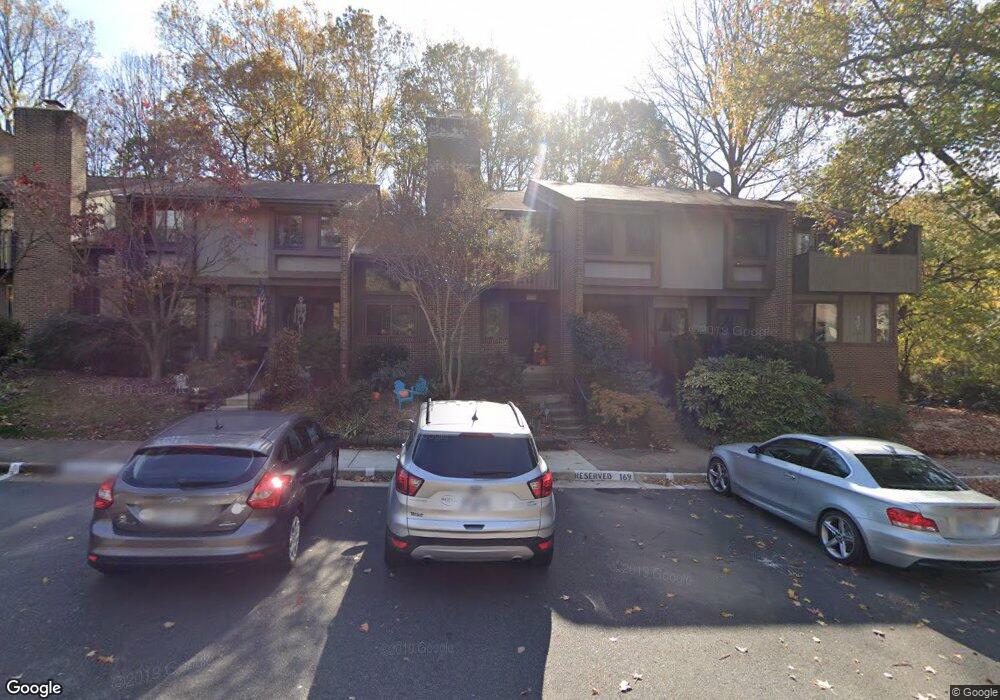
2121 Glencourse Ln Reston, VA 20191
Estimated Value: $594,332 - $657,000
3
Beds
3
Baths
1,405
Sq Ft
$443/Sq Ft
Est. Value
About This Home
This home is located at 2121 Glencourse Ln, Reston, VA 20191 and is currently estimated at $623,083, approximately $443 per square foot. 2121 Glencourse Ln is a home located in Fairfax County with nearby schools including Terraset Elementary, Langston Hughes Middle School, and South Lakes High School.
Ownership History
Date
Name
Owned For
Owner Type
Purchase Details
Closed on
Jun 29, 2010
Sold by
Giudici Cynthia
Bought by
Donovan Kevin L
Current Estimated Value
Home Financials for this Owner
Home Financials are based on the most recent Mortgage that was taken out on this home.
Original Mortgage
$360,431
Outstanding Balance
$240,228
Interest Rate
4.78%
Mortgage Type
FHA
Estimated Equity
$382,855
Purchase Details
Closed on
Feb 16, 2010
Sold by
Ets Of Virginia Inc Trustee and Montgomery Sung S
Bought by
Giudici Cynthia
Purchase Details
Closed on
Jun 25, 2001
Sold by
Bennajma Jean D
Bought by
Montgomery Sung Sil
Home Financials for this Owner
Home Financials are based on the most recent Mortgage that was taken out on this home.
Original Mortgage
$198,000
Interest Rate
7.09%
Purchase Details
Closed on
May 31, 1996
Sold by
Rubin Gary P
Bought by
Bennajma Jean D
Home Financials for this Owner
Home Financials are based on the most recent Mortgage that was taken out on this home.
Original Mortgage
$138,050
Interest Rate
7.91%
Create a Home Valuation Report for This Property
The Home Valuation Report is an in-depth analysis detailing your home's value as well as a comparison with similar homes in the area
Home Values in the Area
Average Home Value in this Area
Purchase History
| Date | Buyer | Sale Price | Title Company |
|---|---|---|---|
| Donovan Kevin L | $367,500 | -- | |
| Giudici Cynthia | $257,500 | -- | |
| Montgomery Sung Sil | $220,000 | -- | |
| Bennajma Jean D | $139,000 | -- |
Source: Public Records
Mortgage History
| Date | Status | Borrower | Loan Amount |
|---|---|---|---|
| Open | Donovan Kevin L | $360,431 | |
| Previous Owner | Montgomery Sung Sil | $198,000 | |
| Previous Owner | Bennajma Jean D | $138,050 |
Source: Public Records
Tax History Compared to Growth
Tax History
| Year | Tax Paid | Tax Assessment Tax Assessment Total Assessment is a certain percentage of the fair market value that is determined by local assessors to be the total taxable value of land and additions on the property. | Land | Improvement |
|---|---|---|---|---|
| 2025 | $6,633 | $569,280 | $205,000 | $364,280 |
| 2024 | $6,633 | $550,250 | $200,000 | $350,250 |
| 2023 | $6,281 | $534,300 | $190,000 | $344,300 |
| 2022 | $5,628 | $472,710 | $170,000 | $302,710 |
| 2021 | $5,403 | $442,710 | $140,000 | $302,710 |
| 2020 | $5,384 | $437,540 | $135,000 | $302,540 |
| 2019 | $5,161 | $419,450 | $135,000 | $284,450 |
| 2018 | $4,502 | $391,500 | $110,000 | $281,500 |
| 2017 | $4,943 | $409,200 | $110,000 | $299,200 |
| 2016 | $4,697 | $389,610 | $100,000 | $289,610 |
| 2015 | $4,531 | $389,610 | $100,000 | $289,610 |
| 2014 | $4,521 | $389,610 | $100,000 | $289,610 |
Source: Public Records
Map
Nearby Homes
- 11648 Ivystone Ct Unit 1B2
- 11735 Ledura Ct Unit 201
- 11564 Rolling Green Ct Unit 12/100B
- 2015 Soapstone Dr
- 11428 Purple Beech Dr
- 2050 Golf Course Dr
- 2210 Coppersmith Square
- 2218 Castle Rock Square Unit 22C
- 2220 Springwood Dr Unit K
- 11604 Stoneview Square Unit 64/21C
- 2224 Springwood Dr Unit 102A
- 11713 Karbon Hill Ct Unit 710A
- 2233 Lovedale Ln Unit I
- 2029 Wethersfield Ct
- 2037 Wethersfield Ct
- 11817 Coopers Ct
- 11825 Coopers Ct
- 11709H Karbon Hill Ct Unit 609A
- 11709 Karbon Hill Ct Unit 606A
- 2134 Golf Course Dr
- 2119 Glencourse Ln
- 2117 Glencourse Ln
- 2123 Glencourse Ln
- 2115 Glencourse Ln
- 2125 Glencourse Ln
- 2113 Glencourse Ln
- 2111 Glencourse Ln
- 2109 Glencourse Ln
- 2107 Glencourse Ln
- 2126 Glencourse Ln
- 2144 Glencourse Ln
- 2146 Glencourse Ln
- 2142 Glencourse Ln
- 2140 Glencourse Ln
- 2148 Glencourse Ln
- 2128 Glencourse Ln
- 2138 Glencourse Ln
- 2105 Glencourse Ln
- 2136 Glencourse Ln
- 2061 Winged Foot Ct