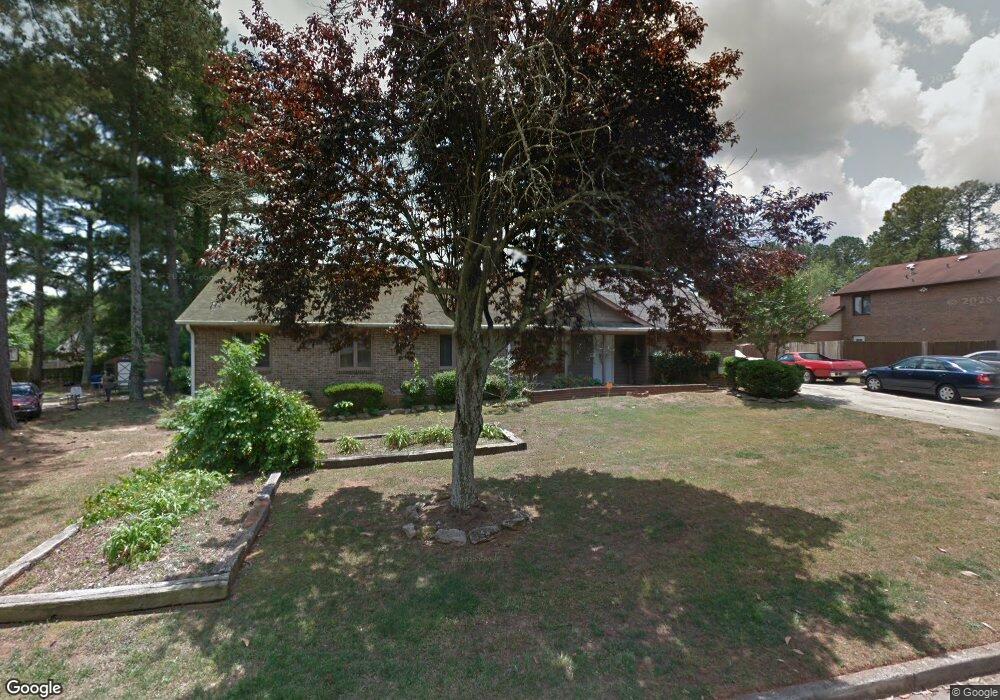
2121 Golfview Dr SE Conyers, GA 30013
Estimated Value: $223,000 - $289,000
2
Beds
1
Bath
1,112
Sq Ft
$233/Sq Ft
Est. Value
About This Home
This home is located at 2121 Golfview Dr SE, Conyers, GA 30013 and is currently estimated at $259,000, approximately $232 per square foot. 2121 Golfview Dr SE is a home located in Rockdale County with nearby schools including Peek's Chapel Elementary School, Memorial Middle School, and Salem High School.
Ownership History
Date
Name
Owned For
Owner Type
Purchase Details
Closed on
May 16, 2022
Sold by
Thomas Shelanda Goodman
Bought by
Chipro Jesse Jones
Current Estimated Value
Home Financials for this Owner
Home Financials are based on the most recent Mortgage that was taken out on this home.
Original Mortgage
$293,243
Outstanding Balance
$277,287
Interest Rate
4.75%
Mortgage Type
FHA
Estimated Equity
-$18,287
Purchase Details
Closed on
Jan 15, 2022
Sold by
Thomas Luther Samuel
Bought by
Thomas Shelanda Goodman
Purchase Details
Closed on
Apr 30, 2010
Sold by
Hud-Housing Of Urban Dev
Bought by
Thomas Luther S
Purchase Details
Closed on
Apr 7, 2009
Sold by
Midfirst Bank
Bought by
Hud-Housing Of Urban Dev
Purchase Details
Closed on
Dec 9, 1997
Sold by
Schmitzer William D and Schmitzer Bonita
Bought by
Redden Iran J
Home Financials for this Owner
Home Financials are based on the most recent Mortgage that was taken out on this home.
Original Mortgage
$123,824
Interest Rate
7.19%
Mortgage Type
FHA
Create a Home Valuation Report for This Property
The Home Valuation Report is an in-depth analysis detailing your home's value as well as a comparison with similar homes in the area
Home Values in the Area
Average Home Value in this Area
Purchase History
| Date | Buyer | Sale Price | Title Company |
|---|---|---|---|
| Chipro Jesse Jones | $298,700 | -- | |
| Thomas Shelanda Goodman | -- | -- | |
| Thomas Luther S | $60,550 | -- | |
| Hud-Housing Of Urban Dev | $112,404 | -- | |
| Midfirst Bk | $112,404 | -- | |
| Redden Iran J | $127,100 | -- |
Source: Public Records
Mortgage History
| Date | Status | Borrower | Loan Amount |
|---|---|---|---|
| Open | Chipro Jesse Jones | $293,243 | |
| Previous Owner | Redden Iran J | $123,824 |
Source: Public Records
Tax History Compared to Growth
Tax History
| Year | Tax Paid | Tax Assessment Tax Assessment Total Assessment is a certain percentage of the fair market value that is determined by local assessors to be the total taxable value of land and additions on the property. | Land | Improvement |
|---|---|---|---|---|
| 2024 | $1,408 | $62,360 | $23,080 | $39,280 |
| 2023 | $1,165 | $54,560 | $15,400 | $39,160 |
| 2022 | $1,735 | $39,960 | $9,040 | $30,920 |
| 2021 | $482 | $27,440 | $5,160 | $22,280 |
| 2020 | $252 | $22,240 | $3,000 | $19,240 |
| 2019 | $165 | $19,240 | $2,160 | $17,080 |
| 2018 | $37 | $15,080 | $2,160 | $12,920 |
| 2017 | $35 | $13,400 | $2,160 | $11,240 |
| 2016 | $35 | $13,400 | $2,160 | $11,240 |
| 2015 | $36 | $13,400 | $2,160 | $11,240 |
| 2014 | $40 | $12,680 | $2,160 | $10,520 |
| 2013 | -- | $16,440 | $4,000 | $12,440 |
Source: Public Records
Map
Nearby Homes
- 2649 Fieldstone View Ln SE Unit A
- 2649 Fieldstone View Ln SE
- 2628 Essex Ct
- 2145 Country Walk Way SE
- 2585 Golfview Terrace SE
- 3121 Baywood Ct
- 2251 Country Club Dr SE Unit 1
- 3803 Yorkshire Ct
- 3639 Cape Ln
- 2303 Country Club Dr SE
- 128 Avondale Blvd SE
- 288 Avondale Blvd
- 102 Avondale Blvd
- 3452 SE Sandstone Trail
- 3011 Viewpark Cir
- 7005 Old Bridge Ln
- 3002 Viewpark Cir
- 3015 Viewpark Cir
- 3022 Viewpark Cir
- 3019 Viewpark Cir
- 2121 Golfview Dr SE Unit 2122
- 2123 Golfview Dr SE
- 2615 Fieldstone View Ln SE
- 2615 Fieldstone View Ln SE Unit 3
- 2127 Golfview Dr SE
- 2122 Fieldstone View Ct SE Unit 2122
- 2122 Fieldstone View Ct SE
- 2122 Fieldstone View Ct SE Unit 2124A
- 2122 Fieldstone View Ct SE Unit 2124B
- 2118 Fieldstone View Ct SE
- 2617 Fieldstone View Ln SE
- 2617 Fieldstone View Ln SE Unit 7C
- 2617 Fieldstone View Ln SE Unit LN
- 2126 Golfview Dr SE
- 2126 Fieldstone View Ct SE
- 2126 Fieldstone View Ct SE Unit B
- 2619 Fieldstone View Ln SE
- 2122 Golfview Dr SE
- 2616 Fieldstone View Ln SE
- 2114 Golfview Dr SE Unit 2116