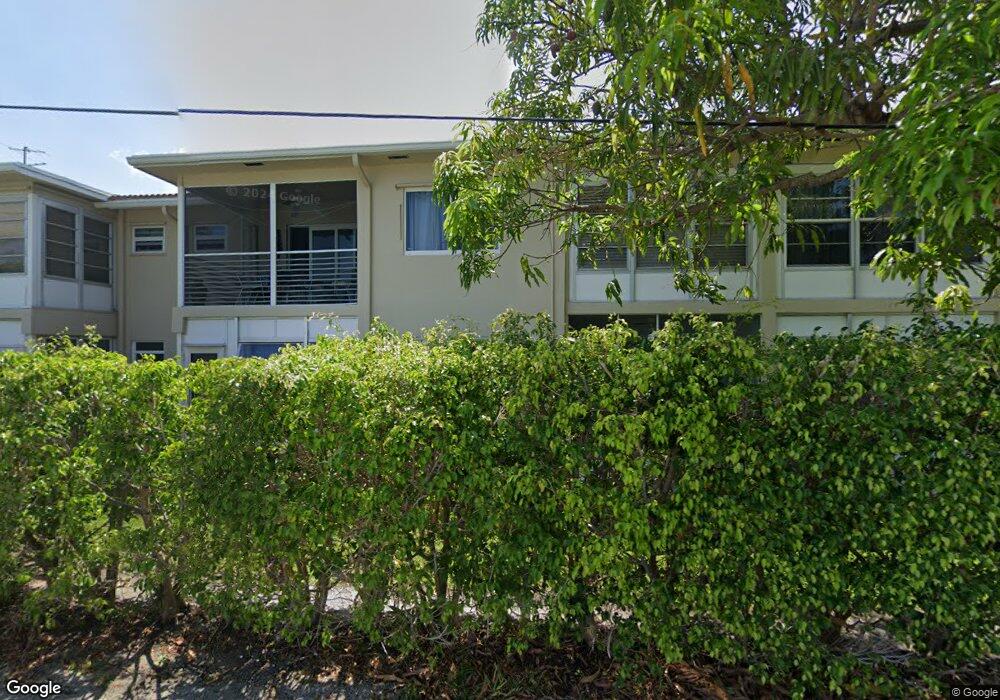
2121 NE 42nd Ct Unit 201C Lighthouse Point, FL 33064
Estimated Value: $152,000 - $170,000
3
Beds
2
Baths
960
Sq Ft
$167/Sq Ft
Est. Value
About This Home
This home is located at 2121 NE 42nd Ct Unit 201C, Lighthouse Point, FL 33064 and is currently estimated at $160,406, approximately $167 per square foot. 2121 NE 42nd Ct Unit 201C is a home located in Broward County with nearby schools including Norcrest Elementary School, Deerfield Beach Middle School, and Deerfield Beach High School.
Ownership History
Date
Name
Owned For
Owner Type
Purchase Details
Closed on
Aug 25, 2023
Sold by
Markovskaya Lily
Bought by
Motta Rui and Motta Kezia Cadeira
Current Estimated Value
Purchase Details
Closed on
Jul 13, 2023
Sold by
Markovskaya Lily
Bought by
Markovskaya Lily
Purchase Details
Closed on
Aug 15, 2002
Sold by
Walton Evyn H
Bought by
Markovskaya Lily
Home Financials for this Owner
Home Financials are based on the most recent Mortgage that was taken out on this home.
Original Mortgage
$44,550
Interest Rate
6.49%
Purchase Details
Closed on
Aug 14, 2002
Sold by
Calcasola Carlo and Calcasola Mary E
Bought by
Walton Evyn H
Home Financials for this Owner
Home Financials are based on the most recent Mortgage that was taken out on this home.
Original Mortgage
$44,550
Interest Rate
6.49%
Create a Home Valuation Report for This Property
The Home Valuation Report is an in-depth analysis detailing your home's value as well as a comparison with similar homes in the area
Home Values in the Area
Average Home Value in this Area
Purchase History
| Date | Buyer | Sale Price | Title Company |
|---|---|---|---|
| Motta Rui | $155,000 | Title Pros | |
| Markovskaya Lily | -- | None Listed On Document | |
| Markovskaya Lily | $49,500 | Alliance Title Company | |
| Walton Evyn H | -- | Alliance Title Company |
Source: Public Records
Mortgage History
| Date | Status | Borrower | Loan Amount |
|---|---|---|---|
| Previous Owner | Markovskaya Lily | $44,550 |
Source: Public Records
Tax History Compared to Growth
Tax History
| Year | Tax Paid | Tax Assessment Tax Assessment Total Assessment is a certain percentage of the fair market value that is determined by local assessors to be the total taxable value of land and additions on the property. | Land | Improvement |
|---|---|---|---|---|
| 2025 | $2,479 | $129,660 | -- | -- |
| 2024 | $1,312 | $126,010 | $13,890 | $125,030 |
| 2023 | $1,312 | $46,890 | $0 | $0 |
| 2022 | $1,049 | $45,530 | $0 | $0 |
| 2021 | $1,013 | $44,210 | $0 | $0 |
| 2020 | $761 | $43,600 | $0 | $0 |
| 2019 | $737 | $42,620 | $0 | $0 |
| 2018 | $710 | $41,830 | $0 | $0 |
| 2017 | $619 | $40,970 | $0 | $0 |
| 2016 | $589 | $40,130 | $0 | $0 |
| 2015 | $249 | $39,860 | $0 | $0 |
| 2014 | $389 | $39,550 | $0 | $0 |
| 2013 | -- | $38,970 | $3,900 | $35,070 |
Source: Public Records
Map
Nearby Homes
- 2121 NE 42nd Ct Unit 202C
- 2331 Vintage Dr
- 2329 Vintage Dr
- 2131 NE 42nd Ct Unit 212E
- 2131 NE 42nd Ct Unit 208E
- 2131 NE 42nd Ct Unit 104E
- 2111 NE 42nd Ct Unit 103W
- 2131 NE 42nd Ct Unit 211E
- 2115 NE 42nd Ct Unit 104N
- 2131 NE 42nd Ct Unit 202E
- 2111 NE 42nd Ct Unit 201W
- 2131 NE 42nd Ct Unit 209E
- 2115 NE 42nd Ct Unit 110N
- 2131 NE 40th Ct
- 2161 NE 42nd Ct Unit 114
- 2317 Vintage Dr
- 2344 Vintage Dr
- 2151 NE 42nd Ct Unit 230
- 2151 NE 42nd Ct Unit 204
- 2151 NE 42nd Ct Unit 237E
- 2121 NE 42nd Ct
- 2121 NE 42nd Ct Unit 109
- 2121 NE 42nd Ct Unit 108C
- 2121 NE 42nd Ct Unit 209
- 2121 NE 42nd Ct Unit 112C
- 2121 NE 42nd Ct Unit 101C
- 2121 NE 42nd Ct Unit 106C
- 2121 NE 42nd Ct Unit 212C
- 2121 NE 42nd Ct Unit 204
- 2121 NE 42nd Ct Unit 203C
- 2121 NE 42nd Ct Unit 210C
- 2121 NE 42nd Ct Unit 208C
- 2121 NE 42nd Ct Unit 207C
- 2121 NE 42nd Ct Unit 110C
- 2121 NE 42nd Ct Unit 205C
- 2121 NE 42nd Ct Unit 111C
- 2121 NE 42nd Ct Unit 107C
- 2121 NE 42nd Ct Unit 104