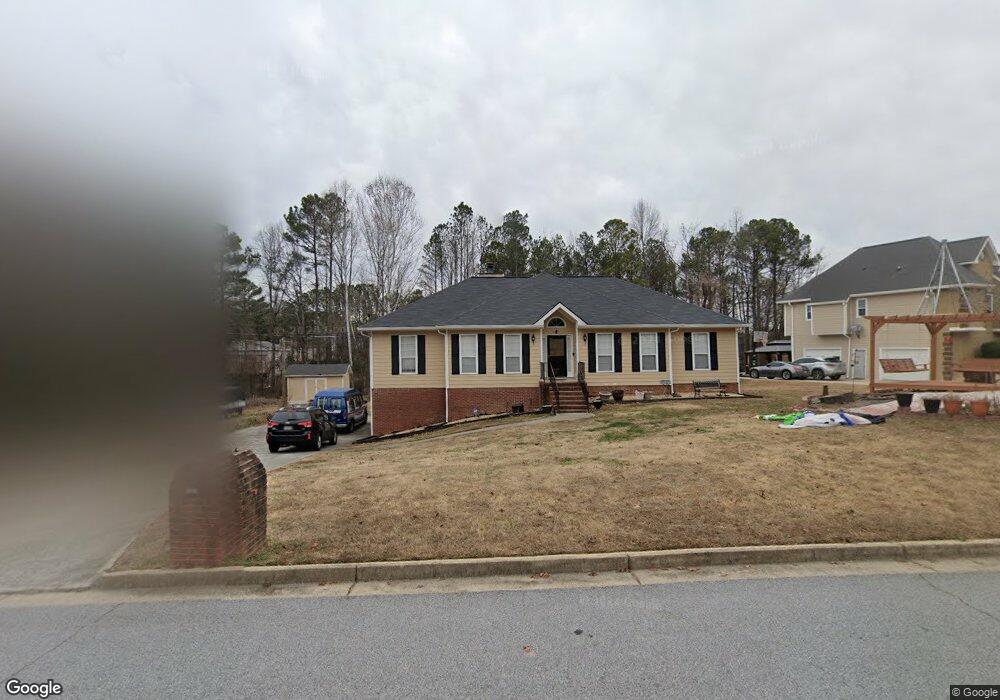
2121 Oakleaf Ln Unit 3 Lithia Springs, GA 30122
Lithia Springs NeighborhoodEstimated Value: $311,269 - $353,000
3
Beds
3
Baths
2,858
Sq Ft
$116/Sq Ft
Est. Value
About This Home
This home is located at 2121 Oakleaf Ln Unit 3, Lithia Springs, GA 30122 and is currently estimated at $331,817, approximately $116 per square foot. 2121 Oakleaf Ln Unit 3 is a home located in Douglas County with nearby schools including Sweetwater Elementary School, Chestnut Log Middle School, and Lithia Springs Comprehensive High School.
Ownership History
Date
Name
Owned For
Owner Type
Purchase Details
Closed on
Jul 30, 2021
Sold by
Blalock Albertina G
Bought by
Blalock Albertina G and Blalock Phil
Current Estimated Value
Purchase Details
Closed on
Oct 5, 2011
Sold by
Secretary Of Housing And U
Bought by
Bowen Albertina G
Home Financials for this Owner
Home Financials are based on the most recent Mortgage that was taken out on this home.
Original Mortgage
$98,932
Interest Rate
4.2%
Mortgage Type
New Conventional
Purchase Details
Closed on
Feb 2, 2010
Sold by
Citimortgage
Bought by
Hud-Housing Of Urban Dev
Purchase Details
Closed on
Jun 23, 2004
Sold by
Kulczak Christopher A and Kulczak Brenda
Bought by
Brown Lambert R and Brown Kimberly
Home Financials for this Owner
Home Financials are based on the most recent Mortgage that was taken out on this home.
Original Mortgage
$189,050
Interest Rate
6.25%
Mortgage Type
VA
Create a Home Valuation Report for This Property
The Home Valuation Report is an in-depth analysis detailing your home's value as well as a comparison with similar homes in the area
Home Values in the Area
Average Home Value in this Area
Purchase History
| Date | Buyer | Sale Price | Title Company |
|---|---|---|---|
| Blalock Albertina G | -- | -- | |
| Bowen Albertina G | -- | -- | |
| Hud-Housing Of Urban Dev | -- | -- | |
| Citimortgage Inc | $216,646 | -- | |
| Brown Lambert R | $190,700 | -- |
Source: Public Records
Mortgage History
| Date | Status | Borrower | Loan Amount |
|---|---|---|---|
| Previous Owner | Bowen Albertina G | $98,932 | |
| Previous Owner | Brown Lambert R | $189,050 |
Source: Public Records
Tax History Compared to Growth
Tax History
| Year | Tax Paid | Tax Assessment Tax Assessment Total Assessment is a certain percentage of the fair market value that is determined by local assessors to be the total taxable value of land and additions on the property. | Land | Improvement |
|---|---|---|---|---|
| 2024 | $672 | $121,040 | $24,000 | $97,040 |
| 2023 | $397 | $121,040 | $24,000 | $97,040 |
| 2022 | $697 | $112,080 | $19,200 | $92,880 |
| 2021 | $2,177 | $75,800 | $8,000 | $67,800 |
| 2020 | $1,942 | $62,800 | $6,796 | $56,004 |
| 2019 | $1,833 | $62,800 | $6,796 | $56,004 |
| 2018 | $1,779 | $79,240 | $8,800 | $70,440 |
Source: Public Records
Map
Nearby Homes
- 3078 Standing Rock Ct
- 2732 Montie Ct
- 2390 Fairburn Rd Unit 237
- 2071 Oakcreek Dr
- 8767 N View Dr
- 8767 Northview Dr
- 2740 Montie Ct
- 3957 Fairhaven Rd
- 2741 Montie Ct
- 3924 Fairhaven Rd
- 3940 Fairhaven Rd
- 3964 Fairhaven Rd
- 1928 Stonewood Dr
- 3948 Fairhaven Rd
- 2756 Montie Ct
- 2808 Lillian Ln
- HAYDEN Plan at Fairhaven
- GREEN Plan at Fairhaven
- CALI Plan at Fairhaven
- ELLE Plan at Fairhaven
- 2121 Oakleaf Ln
- 2111 Oakleaf Ln Unit 3
- 2125 Oakleaf Ln
- 2129 Oakleaf Ln Unit 3
- 2122 Oakleaf Ln Unit 3
- 2097 Oakleaf Ln Unit 3
- 2114 Oakleaf Ln Unit 3
- 2160 Stenger Rd
- 2126 Oakleaf Ln
- 2118 Oakleaf Ln
- 2110 Oakleaf Ln Unit 3
- 2093 Oakleaf Ln
- 2130 Oakleaf Ln
- 2180 Stenger Rd
- 2106 Oakleaf Ln Unit 3
- 2089 Oakleaf Ln
- 2184 Stenger Rd Unit 3
- 2184 Stenger Rd Unit 23
- 2134 Oakleaf Ln
- 2102 Oakleaf Ln